Baffle Step as a Pressure Director, Not Booster:
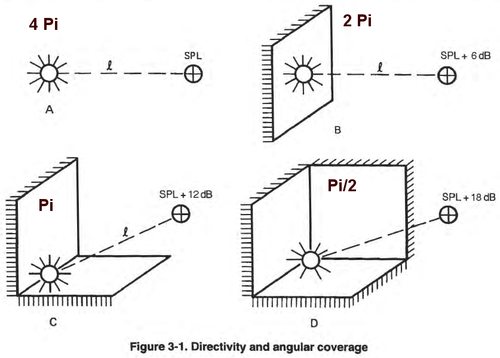
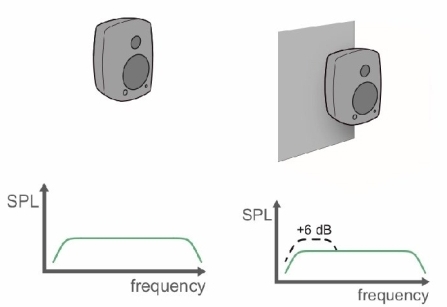
While baffle step doesn’t create an overall gain in sound pressure, it acts like a pressure director, concentrating sound waves in the forward direction (towards the listener) for frequencies above the baffle step frequency. This can be visualized as:
At low frequencies the sound wavelength is large compared to the baffle size:
Sound from the driver radiates freely in all directions (think of a sphere),resulting in omnidirectional radiation (4π steradians).
When frequency increases and the wavelength becomes comparable to the baffle dimensions:
-
The cabinet dimensions start to influence the sound radiation pattern and pass the radiation to 4π to 2π leading to a pressure increase in the forward direction due to a more focused radiation pattern (generaly +6dB SPL).
-
Diffraction around the edges creates additional wavefronts at transition from 4π to 2π that interfere with the original waves from the driver. These interferences will causes cancellations or sommations at transition. Diffraction and Standing Waves article goes deep in these two concepts.
This combined effect leads to a global pressure increase in the forward axis from a frequency related to baffle dimensions and a beam of sound at transition.
The Energy point of view
While the baffle analogy is helpful, it’s important to remember that baffle step doesn’t create a uniform gain.
This difference of front pressure is more a delta due to a difference in energy distribution than a plus or minus, to the energy point of view there is no loss or gain, the energy remain the same, only the his direction is changing, creating a energy focusing effect.
The analogy of a 180-degree horn is apt. Similar to a horn, the baffle acts to channel and focus sound waves in a specific direction. However, unlike a true horn that uses its shape to progressively increase pressure by loading and acoustic loading, the baffle doesn’t create new energy. It simply redirects existing energy.
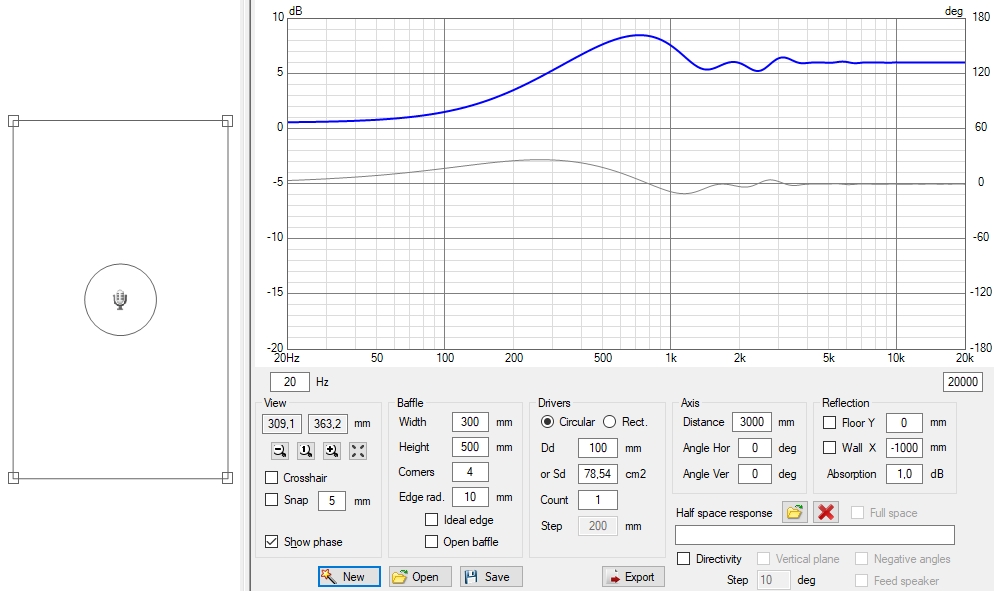
How to simulate it
The pressure increase in the forward direction is gradual and depends on the specific baffle size and frequency, as we can simulate it in VituixCAD with the Diffraction tool:
Baffle mistakes and solutions
For a tweeter without a waveguide, placing it in an asymmetrical position on the baffle is a good solution to distribute baffle diffraction (beaming), while keeping the midrange driver (if present) perfectly vertical to the tweeter.
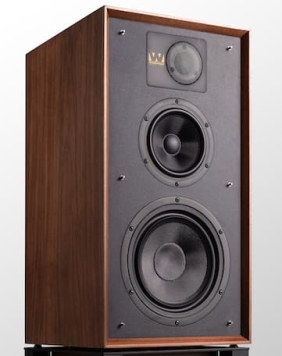
The worst baffle step is caused by the “vintage” approach, which provokes a lot of diffraction affecting both on- and off-axis responses:
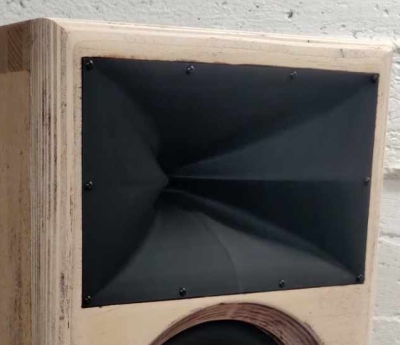
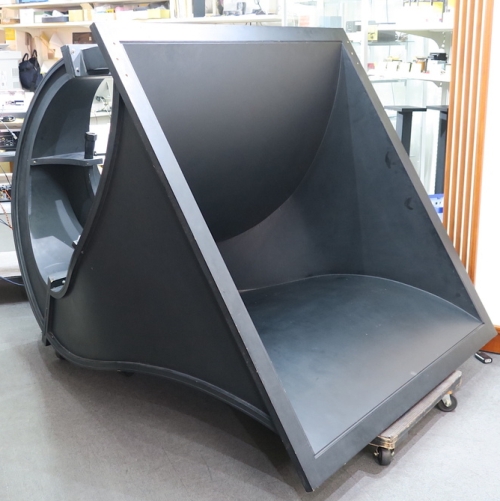
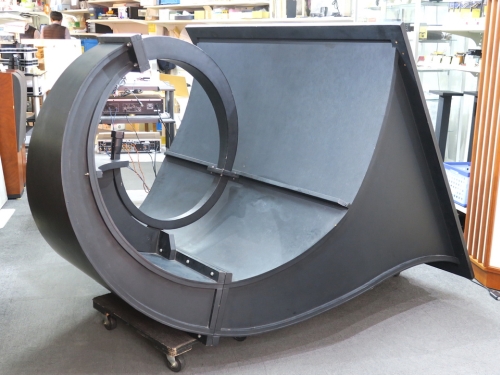
For horn versions, there is also a problem with the horn itself: it does not transition to flat at the baffle junction, and lacks a proper roundover to smoothly meet the cabinet sides. Creating significant midrange narrowing that negatively affects directivity.
As discussed in the midrange narrowing article, a large baffle will not solve the problem with a horn, its size only moves the edge diffraction problem further away. The profile must transition from the horn’s acceleration to a flat 180° surface and immediately include a proper roundover to the cabinet sides in a free-standing case. We still need to accelerate and then decelerate gradually.
For waveguides or horns, it is always better to have a continuous profile, avoiding flat areas between the horn and the edges, as seen here with the X-shape X25:
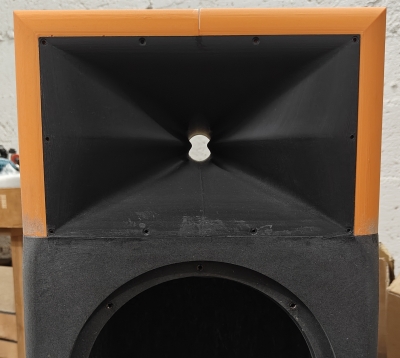
We can note the roundover with a reduced radius on the black cabinet, illustrating the advantage of midrange narrowing in this case for the woofer, while of course keeping a proper roundover for the horn.
This effect is also deeply explained in our Free-Standing vs In-Wall Mounting article.
![]()
This text delves into how ITDG (Initial Time Delay Gap), EDT (Early Decay), critical distance, radiation coverage, and speaker directivity all influence the perception of space and sound clarity within a real room, focusing on aspects relevant to living rooms and home theaters.
Understanding ITDG
ITDG refers to the time difference between the arrival of the direct sound from a source (speaker, instrument, voice, etc.) and the arrival of the first significant reflections of that sound bouncing off the walls, ceiling, and floor.
ITDG and the Perception of Clarity
A room’s ITDG plays a crucial role in how clear the sound feels. Here’s the impact:
-
Short ITDG (less than 20ms): While a very short ITDG can enhance clarity to some extent, it can also create an unnaturally dry and sterile sound, lacking the richness of natural reverberation.
-
Optimal ITDG Range (20ms - 50ms): This range is generally considered ideal for good clarity in rooms like living rooms and home theaters. Early reflections arrive soon enough to reinforce the direct sound and improve intelligibility, but not so soon that they create an overly dry or “in-your-face” listening experience.
-
Long ITDG (over 50ms): As you pointed out, longer ITDGs can lead to a decrease in clarity by creating noticeable echoes and muddying the sound. This can be particularly detrimental for speech intelligibility, especially in dialogue-heavy content.
Note: range and value can vary from one author or research to another and about preferences.
Critical Distance and Radiation Coverage
-
Critical Distance: This is the distance from a sound source where the direct sound and the first reflections arrive at the listener’s ears with roughly equal intensity. Within this distance, the ITDG has a significant impact on perceived clarity. Beyond the critical distance, the influence of the room’s reflections becomes less prominent.
-
Radiation Coverage: This refers to the area effectively covered by a speaker’s sound dispersion pattern. It’s important to consider the radiation coverage of your speakers in relation to the listening distance and room shape.
Relationship to ITDG and Directivity
-
Speaker Directivity: Speakers with a wider directivity pattern (less focused sound dispersion) tend to create a larger critical distance. This means that ITDG plays a more significant role in shaping the perceived clarity at greater listening distances.
-
Adapting Radiation Coverage: By strategically placing speakers with appropriate constant directivity speakers adapted to listening distance, you can influence the ITDG experienced within the room..
Early Decay Time (EDT) and its Impact
EDT is the time it takes for the sound level in a room to decrease by 60 dB after the source has stopped emitting sound. This decay is primarily caused by the absorption of sound by the room’s surfaces (walls, ceiling, floor, furniture, acoustics, etc.).
The Relationship Between EDT and ITDG
While ITDG is influenced by the room’s shape, size, and the placement of sound sources and listeners, the absorption characteristics of the room (reflected in the EDT) also play a significant role:
-
High Absorption, Short EDT: If a room has a high absorption coefficient (meaning it absorbs sound waves efficiently), the first reflections will arrive weaker and decay more rapidly. This can lead to a shorter ITDG because the gap between the direct sound and the remaining reflections becomes smaller.
-
Low Absorption, Long EDT: Conversely, in a room with low absorption (meaning sound waves reflect more readily), the first reflections will be stronger and take longer to decay. This can contribute to a longer ITDG as the first significant reflection arrives later, increasing the time difference between it and the direct sound.
Optimizing for Clarity: Balancing ITDG and EDT
When aiming for good acoustics in a living room or home theater, it’s important to consider both ITDG and EDT:
-
Balancing ITDG: As discussed previously, an optimal ITDG range (around 20ms-50ms) is desirable for clear sound.
-
Managing EDT: A moderate EDT (around 0.5s-1.0s for living rooms and home theaters) helps control unwanted reverberation without creating an overly dry and sterile sound.
Optimizing Your Room’s Acoustics
When optimizing ITDG and sound clarity in your living room or home theater, consider these points:
When aiming for optimal Initial Time Delay Gap (ITDG) and sound clarity in your living room or home theater, consider these key factors:
-
Speaker Selection: Choose speakers with directivity patterns that suit your listening distance and room acoustics. Wider directivity create a larger critical distance (where direct sound and early reflections have similar intensity), influencing how ITDG affects perceived clarity, especially at greater distances.
-
Strategic Speaker Placement: Strategically position speakers based on their directivity and desired ITDG. Avoid placing them too close to side walls, as this can negatively impact sound quality.
While a slight “toe-in” angle can sometimes improve focus at larger listening distances, use it cautiously. Excessive toe-in narrows the “sweet spot” and can reduce overall clarity. This is because it increases directivity too much, leading to tonal imbalance. Additionally, over-toe-in cannot compensate for a large variation in Direct-to-Reverberant Energy Ratio (DI, for Directivity Index).
-
Absorption Acoustic Treatment: Utilize sound-absorbing materials like acoustic panels, thick curtains, or carpets on walls and ceilings. This helps soak up unwanted reflections, shorten ITDG, and improve overall clarity.
-
Diffusion Acoustic Treatment: Consider incorporating diffusers to scatter sound more evenly throughout the room. This can reduce the impact of strong direct reflections and further enhance overall clarity.
In most cases, proper acoustic treatment combined with speakers that offer constant directivity with a coverage adapted to your listening distance, oriented to the central listening position, will provide the more effective solution.
Constant Directivity
While constant directivity speakers (those that radiate sound uniformly across frequencies) can offer some advantages:
Consistent ITDG: Constant directivity speakers can help maintain a more consistent ITDG across the listening area, regardless of the frequency content of the sound. This can be beneficial for achieving a more uniform and predictable sound experience.
C20 and C50 Integration Times Explained:
The Time Period of Integration (TPI) represents the time window during which our auditory system fuses sound reflections with the direct sound, perceiving them as a single event rather than distinct echoes. This “fusion effect” is crucial for spatial perception and clarity. The TPI varies with frequency, distance, and other factors such as sound complexity, listening environment, and listener age. To understand how TPI influences our perception and room acoustics, see the detailed explanation at Critical Distance — Time Period of Integration (TPI).
In the context of EDT measurement using the exponential sine sweep method, C20 and C50 represent different integration times used when calculating the decay curve. These integration times essentially filter the measured data to focus on specific frequency ranges:
-
C20: This integration time emphasizes the decay of mid-range frequencies (around 200 Hz to 4 kHz) which are particularly important for speech intelligibility.
-
C50: This integration time considers a broader frequency range (around 50 Hz to 10 kHz) and provides a more holistic picture of the room’s overall reverberation characteristics.
By analyzing the decay curve using both C20 and C50 integration times, acoustic professionals can gain a more comprehensive understanding of the room’s absorption properties at different frequencies, which ultimately influences both ITDG and overall sound clarity.
Conclusion
By understanding ITDG, critical distance, radiation coverage, and speaker directivity, you can achieve a more comprehensive approach to optimizing the acoustics in your living room or home theater. By considering these factors alongside the previously mentioned techniques, you can create a space with clear, well-balanced sound that enhances your listening experience.
![]()
What is Critical Distance ?
In sound reproduction, achieving a balanced listening experience depends on the interaction between the direct sound from the speakers and the reflected sound bouncing around the room (often referred to as the diffuse field).
This ideal balance is often described as a 50/50 ratio of direct to reverberated sound. However, this is a guideline, and preferences can vary depending on the music and your personal taste, with some favoring a 60/40 or 40/60 mix.
The critical distance is the distance from the speakers where the direct and reflected sound levels become roughly equal. It’s influenced by some key factors:
-
Room Acoustics (Sabine Absorption): Sabine absorption refers to the total amount of sound energy absorbed in a room, calculated using the Sabine equation, which relates reverberation time to the room’s volume and absorption properties. Higher absorption reduces reverberation, while lower absorption increases it.
Mathematically, rooms with lower absorption (more reflective surfaces, low alpha sabine) should have a longer critical distance, as the direct sound needs to travel farther before reaching a 50/50 balance with the reverberant field.
However, in practice, the opposite effect is often observed because the reverberant field is primarily sustained by sidewall reflections, while absorption is typically concentrated on the front and/or rear walls and not on side wall to preserve the Listener envelopment, altering the distribution of reflections and increasing the effective critical distance.
-
Speaker Directivity Factor: Speakers with a wider dispersion pattern (spreading sound over a larger area) generally have a shorter critical distance when a narrower ones has a longer one. This is because the off-axis sound increasing sound energy by bouncing off walls and other surfaces.
-
Wider Dispersion: Speakers with a wider dispersion pattern (spreading sound over a larger area) generally have a shorter critical distance. This is because they excite a larger portion of the room with off-axis direct sound, leading to a higher overall level of sound energy reaching the listener even at closer distances. However, these speakers also tend to contribute more to the reverberated field due to the increased sound energy bouncing off walls and other surfaces.
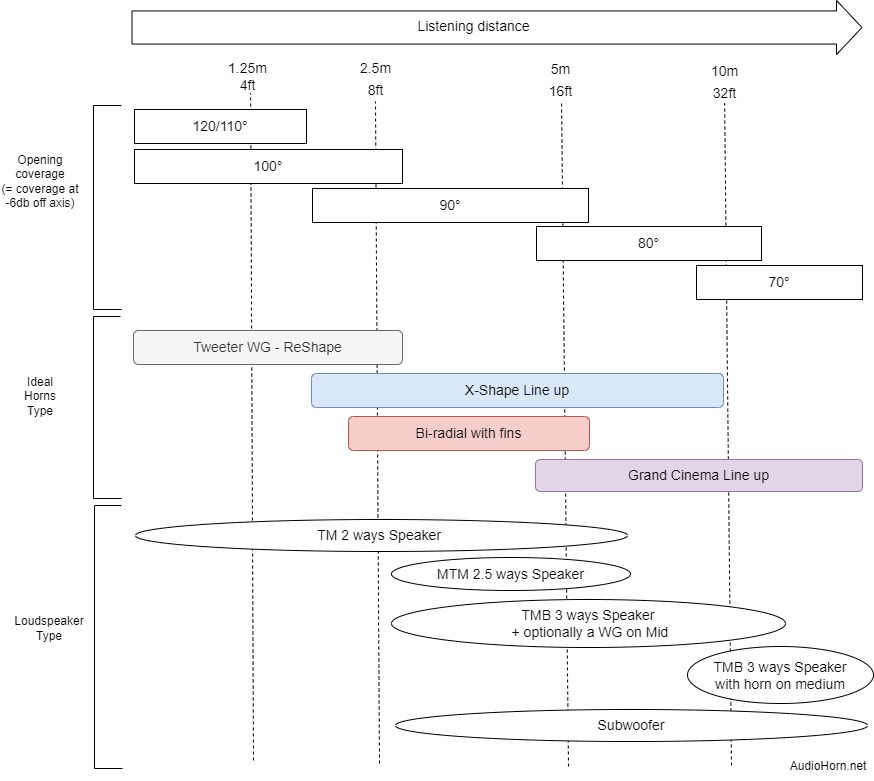
Generally 90° constant directivity horn are adapted from 2/2m50 to 5/6m. -
Narrower Dispersion: In contrast, speakers with a narrower dispersion pattern focus sound energy within a more concentrated cone. This means that a smaller portion of the room is directly excited, requiring a longer listening distance to achieve a similar level of sound energy compared to wider dispersion speakers. While they contribute less to the overall reverberated sound due to the focused sound direction, achieving a balanced sound experience with these speakers might necessitate sitting further away.
Generally 80/70° constant directivity horn are used after 5/6m.
-
Additional Considerations:
-
Frequency and Directivity: The balance between direct and reverberated sound can also vary with frequency due to speaker directivity. Speakers with constant directivity help to maintain a more consistent balance across the listening area.
-
Speaker Placement: While not directly related to critical distance, proper speaker placement can enhance the sound experience. Avoid placing the listening position (sofa) directly against the wall. This ensures the listener isn’t too close to the wall, affecting the ideal balance of direct and reflected sound. Additionally, maintaining some space between the seating area and the walls promotes better sound dispersion throughout the room. Angling the speakers slightly towards the listening area can create a more focused and engaging soundstage.
The formula can be found in Appendix A.
Why Respect It?
Respecting critical distance, along with using constant directivity devices and proper acoustic treatment when possible, allows us to achieve an optimal sound balance in the listening room. This translates to several benefits:
More Neutral and Faithful Sound: By achieving a balanced mix of direct and reflected sound, we hear the audio closer to how it was intended to be heard by the artist or sound engineer. The sound becomes more natural and accurate, avoiding unwanted coloration.
Increased Listening Volume Without Fatigue: Our hearing is generally more sensitive and find their limit at the most sensitive part of our ears. When the critical distance is not respected, especially in rooms with low absorption, reflections can cause an excess of high-frequency energy. This creates a fatiguing and harsh sound, forcing us to listen at lower volumes.
By adapting directivity to our listening distance, we can achieve two key benefits:
-
Controlled High Frequencies: The speaker’s directivity helps focus high-frequency sound towards the listener, reducing uncontrolled reflections and preventing high frequencies from becoming harsh or fatiguing. This targeted approach allows for a more balanced energy spectrum across all frequencies. The highs won’t overpower the lows, resulting in a more natural,faithful and detailed listening experience.
-
Improved Lower Frequency Presence and higher volume listening: With a balanced energy spectrum, we can listen at higher volumes without experiencing ear fatigue caused by excessive high frequencies, critical distance plays a role in how we perceive the low frequencies in comparaison to the high ones when they are controlled according to listening distance and with constant directivity behavior.
When the balance is right, the low frequencies will have a stronger presence without overpowering the rest of the sound.
In simpler terms, respecting critical distance helps us achieve a more natural, balanced, and enjoyable listening experience at higher volumes without listener fatigue.
Modern Speaker Design: Beyond the 120-Degree Coverage Myth
Nowadays, many loudspeakers prioritize achieving a strict 120-degree sound dispersion (directivity) across all frequencies.
However, this “one-120°-coverage-fits-all” approach ignores psychoacoustics (how we hear) and the great impact of listening distance.
In most rooms, a 90-degree horizontal constant directivity provides a more even distribution of sound energy, creating a well-balanced listening experience.
This approach recognizes the concept of critical distance. Conversely, 120 degree dispersion in a typical listening environment will excite the sidewalls too much (creating too much reflected sound) and will make the sound less and less balanced and more and more aggressive the further we go away to the speakers.
Here is a guide for listening distance and type of horn with coverage (most of our horns are availables in several coverage) we can use:
Direct, Reverberated Field and Modal regime
Understanding the behavior of sound waves in a room is crucial for achieving a good listening experience. Here, we’ll differentiate between two key concepts and explore some additional factors influencing low-frequency response:
Direct and Reverberated Field
-
Direct Field: This refers to the sound that travels directly from the source (speakers) to the listener without any reflections from walls or other surfaces. The intensity of the direct field decreases with distance following the inverse square law, meaning it weakens by 6 dB for each doubling of distance. This is why sound gets progressively quieter as you move further away from the speakers.
-
Diffuse or Reverberated Field: A diffuse sound field is one that is homogeneous and isotropic (exhibits the same properties in all directions) throughout the volume of a room at any given time. It is made up of an infinite number of plane waves propagating in all directions. There are no major room-related anomalies to be observed in the measurements. Unlike the direct field, the diffuse field level is considered relatively constant within the listening area. This is because the sound has reflected numerous times and reached the listener from various directions, averaging out any distance-related variations.
It’s important to note: While the diffuse field is considered relatively constant within the listening zone, the overall sound pressure level (SPL) in a room, including the contribution from the diffuse field, will still decrease with distance from the speakers following the inverse square law. This decrease is primarily caused by the direct sound attenuating with distance, while the diffuse field level remains more stable within the listening area.
Modal Regime and Modes:
In addition to the concepts above, two other factors significantly influence how sound behaves in a room, particularly at lower frequencies:
-
Modal Regime: This refers to a situation where reflections are very important but localized and resonate at specific frequencies. These localized reflections coexist with absorptions at nearby frequencies, leading to a chaotic response, especially noticeable in the low frequencies (30-80Hz) of typical living rooms.
-
Modes: These chaotic responses manifest as large peaks and dips (typically +/- 15dB) in the sound pressure level at specific frequencies. They arise because the room dimensions create resonances where sound waves are reflected back and forth, reinforcing certain frequencies and cancelling others.
The consequence of these modes is the creation of resonance frequencies and a type of reverberation that’s specific to the room itself. Even small changes in speaker position can significantly alter this response.
Schroeder Frequency:
The Schroeder frequency is a critical transition zone, often with a wide range, that separates the modal regime from the diffuse field. Below the Schroeder frequency, the modal regime dominates, leading to the chaotic response described earlier. Above the Schroeder frequency, the diffuse field becomes more prominent, with sound reflecting more randomly throughout the room and creating a smoother response.
Room Size and Schroeder Frequency: The size of the room significantly impacts the Schroeder frequency. Larger rooms have a lower Schroeder frequency. In very large rooms, the Schroeder frequency can even fall outside the audible range of human hearing. This means that even low frequencies will exhibit a more diffuse character, which is often considered ideal for listening experiences. In these large rooms, the density of modes in the low frequencies becomes high enough to create a diffuse response.
The formula can be found in Appendix B.
Time Period of Integration (TPI), the brain interpretation:
The time period of integration (TPI) is the time window within which our auditory system perceives sound reflections as part of the direct sound rather than distinct echoes. This phenomenon is known as the “fusion effect.”
- If a reflection (Diffuse Field) arrives within a certain time delay (TPI), it merges with the direct sound, creating a single auditory event.
- If the delay exceeds the TPI, the reflection is perceived as a separate echo.
The TPI depends on several factors:
- Frequency: TPI is generally longer at lower frequencies and shorter at higher frequencies.
- Distance: The TPI increases with the distance between the sound source and the listener.
- Head size: The TPI is slightly affected by the size of the listener’s head.
Additional Factors:
The TPI is influenced by various factors beyond the distance and frequency:
- Sound type: Complex sounds like speech have longer TPIs than pure tones.
- Listening environment: TPI can be longer in noisy environments.
- Listener’s age: TPI tends to increase with age.
- Level difference between direct sound and reflections: Higher level differences lead to shorter TPIs.
Thévenot’s Fusion Curve:
This curve illustrates the relationship between the TPI and the level difference between the direct sound and its reflection.
A higher level difference allows for a longer TPI, meaning that reflections can arrive later without being perceived as echoes.
The formula can be found in Appendix C.
Haas Effect
The Haas effect is a psychoacoustic phenomenon related to the TPI.
If two identical sounds arrive very close together (under 35 milliseconds), our brains perceive them as a single sound coming from the direction of the first sound to arrive.
This allows sound engineers to increase sound level in the back of a room without affecting perceived sound direction by using delaying signal sent to a relay speaker.
In room accoustics in our reverberated field the early reflection on the near wall can create another “virtual” source and enter in Haas effect, it can be negative if the amplitude of this virtual source is too high.
Conclusion and additional considerations:
The critical distance formula is most accurate in ideal conditions with a well-established diffuse sound field (even distribution of sound throughout the room). In real rooms, this might not always be the case.
The formula is also only strictly valid if the listening position is directly on the speaker axis.
There’s no one-size-fits-all solution. Experiment, consider the factors mentioned, and personalize your listening experience, there is no golden rule because every room acoustics is different, but we often see:
- 90° constant directivity horn: 2/2m50 to 5/6m
- 80/70° constant directivity horn: 5/6m and more
- Line array: very long distance outdoors (large festivals, no obstavle), the distance between the center of the first speaker and the center of the last speaker must be equal to or greater than the wavelength of the lowest frequency reproduced, knowing that 80hz is a wavelength of 4m25.
The main goal of line array is in fact to maintain SPL for everybody at distance, nor really the directivity.
Appendix A: Calculating Your Ideal Listening Distance
Experiment with different listening distances to find the sweet spot that sounds best to you.
Consider the size of your room and the type of speakers you have.
Take into account your personal preferences for a more direct or spacious sound.
Critical Distance Formula:
The critical distance, which is the theoretical distance for achieving a 50/50 balance, can be calculated using the following formula:
dc = √(αQ / 50)
Where:
dc is the critical distance in meters
α is the Sabine absorption equivalent in m²/s (explained below)
Q is the directivity factor of the speaker (a value representing how the speaker spreads sound)
Directivity factor represents the speaker’s tendency to focus sound in specific directions compared to an ideal omnidirectional source radiating sound equally in all directions.
High Q: Indicates a more directional speaker, concentrating sound energy in a narrower beam.
Low Q: Indicates a more omnidirectional speaker, radiating sound more evenly.
Understanding Q is crucial in the formula as it influences the critical distance (dc):
Higher Q (more directional): Leads to a greater critical distance. This means you can sit further away from the speaker and still maintain a good balance between direct and reflected sound (50/50 ratio).
Lower Q (less directional): Results in a shorter critical distance. You need to sit closer to the speaker to achieve the desired balance.
Remember:
-
Q is usually measured in decibels (dB).
-
It often varies with frequency.
-
Speaker design significantly impacts directivity.
Sabine Absorption Equivalent (α):
The Sabine absorption equivalent (α) represents the total sound-absorbing capacity of a room. It essentially measures how effectively a room absorbs sound energy and prevents reflections. A higher α value indicates greater sound absorption, leading to a shorter reverberation time (less echo) and a potentially quieter environment. Conversely, a lower α value means more reflections and a longer reverberation time, resulting in a noisier and potentially less comfortable space.
Calculating Sabine Absorption:
The total Sabine absorption of a room can be calculated by summing the product of the surface area of each material and its corresponding sound absorption coefficient (SAC).
Total Absorption (α) = Σ (Surface Area x Sound Absorption Coefficient)
Σ (sigma) represents the summation over all materials in the room.
Sound Absorption Coefficient (SAC):
The sound absorption coefficient (SAC) is a value between 0 (perfectly reflective) and 1 (perfectly absorbent) that specifies how well a particular material absorbs sound at different frequencies. Different materials have different SAC values, and understanding these values is crucial for calculating the total Sabine absorption of a room.
Appendix B: Schroeder frequency formula
Fs = 2000 * √(T/V)
Where:
Fs is the Schroeder frequency in Hertz (Hz)
T is the reverberation time of the room in seconds (s)
V is the volume of the room in cubic meters (m³)
Appendix C: TPI formula
The TPI can be estimated using various formulas, including:
Schroeder’s Formula: TPI = 0.6 * (c / f) * (1 + (d / r))
Blauert’s Formula: TPI = 1.5 * (c / f) * (1 + (d / r))^0.5
Houtgast’s Formula: TPI = 4.2 * (c / f) * (1 + (d / r))^0.4
Where:
c is the speed of sound (approximately 343 m/s)
f is the sound frequency in Hertz (Hz)
d is the distance between the sound source and the listener (in meters)
r is the radius of the listener’s head (approximately 0.0875 m)
![]()
Wavefront Basics and Challenges:
Sound travels in waves, and the shape of the wavefront determines how the sound propagates in horns. Ideally, the wavefront should smoothly follow the horn’s curvature for optimal constant directivity (controlled sound dispersion).
However, horns with diagonal sections pose a challenge. A wavefront, while traveling at the speed of sound, inherently wants to maintain a 90-degree angle to its edges.
This tendency is crucial when the wavefront encounters sudden geometry changes, like those found in diagonal horn sections.
These rapid transitions can “pull” and deform the wavefront in some points, causing a phenomenon called diffraction (bending and spread out).
The Problem: Cross Syndrome in Horns or Waveguides
When a round waveguide transitions too quickly to a square or rectangular shape, bypassing the elliptical stage or another smooth way to do, it creates a sudden change in the wavefront’s edges expansion rate.
This rapid change causes diffraction primarily at the diagonals, disrupting the wavefront in high frequencies. This phenomenon can be named “cross syndrome” as the wavefront will form a cross shape.
Why We Hear It: Audibility
Even subtle changes in the direct sound caused by diffraction will be audible due to how we listen in rooms.
Most listening happens within the “critical distance” where both direct sound from the speaker and reflected sound bouncing off walls contribute significantly in a ratio close to 50/50.
This means even diffraction effects off axis become noticeable even when listening directly in front of the speakers.
These compromised wavefront are audible and present in your listening experience. This will lead to a:
-
“Floating” sensation: The compromised wavefront might seem disconnected from the rest of the soundstage, creating an unnatural spatial impression.
-
Shifting power response: As the off-axis sound degrades with increasing frequency due to diffraction, the perceived balance of the sound can change, making it seem less powerful or detailed at higher frequencies.
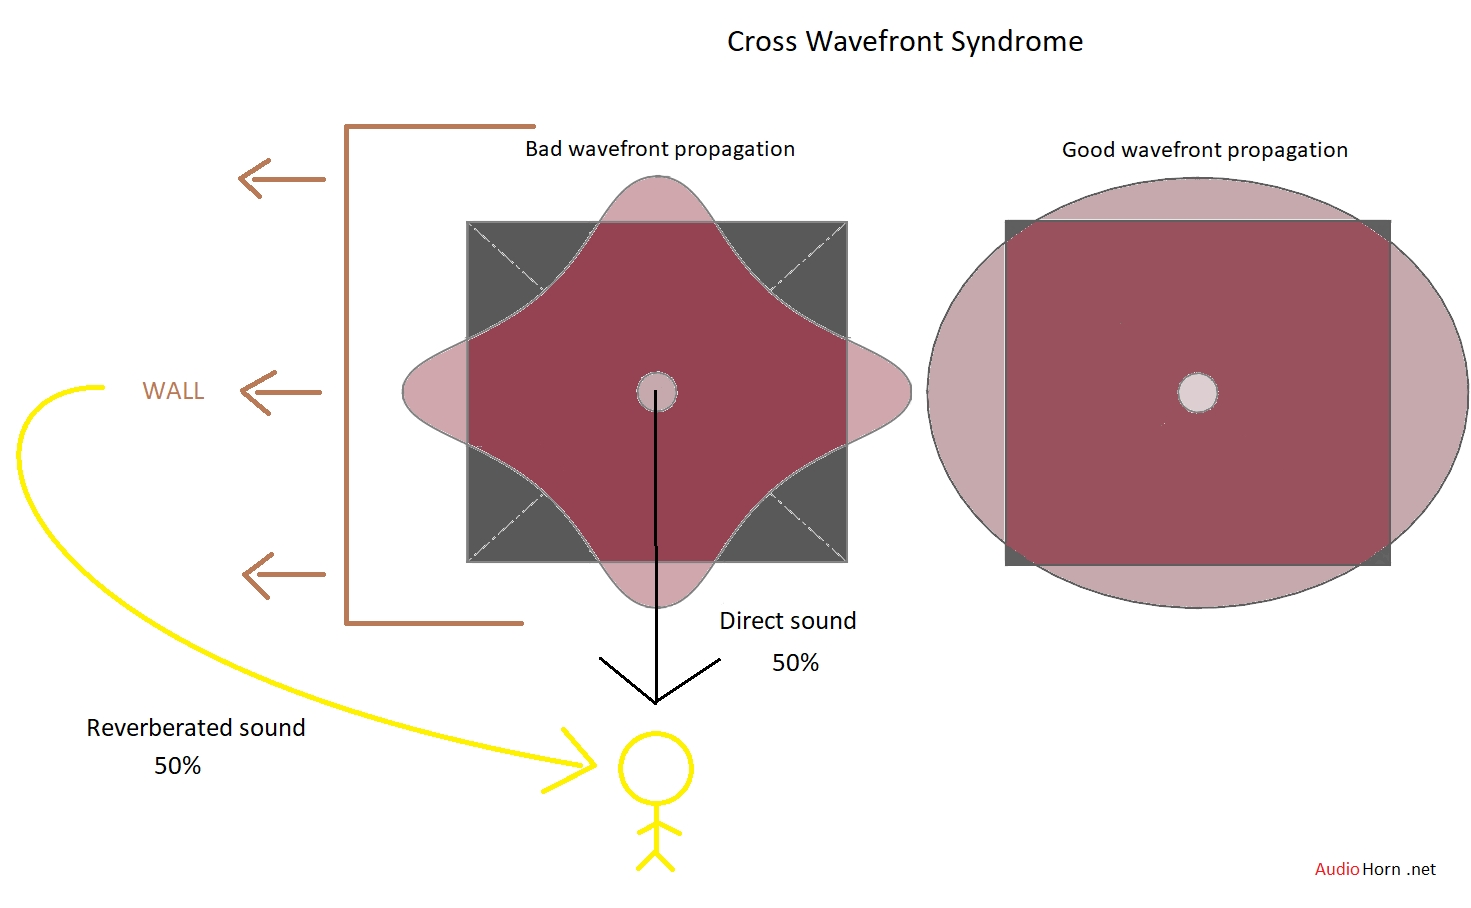
A proper wavefront should be round or elliptical, not cross shaped. The horn mouth is not in cause, it’s the overall profile.
Why some measurement don’t detect it
A horizontal polar is done at a 0° vertical position, and a vertical polar is done at a 0° horizontal position. This means that the measurement is valid on two 2D planes.
Some designs that can suffer from cross wavefront syndrome, such as MEH/synergy horns, should be measured diagonally, and a diagonal polar plot should be provided.
We also need to pay attention to scale. A “half-space” option in VituixCAD displays the polar response over 180° instead of 360°. If we stay in the 360° mode, the scale is affected, and the polar response may appear more consistent than it actually is.
The same issue exists with the color scale, where using solid colors for a 2 or 3 dB range instead of a gradient can hide certain problems.
Lastly, an even simpler issue is with polar maps that start at 0 dB or use the same color for ranges like +6 dB to -2 or -3 dB (and sometimes even down to -6 dB). This completely obscures the true response of the horn.
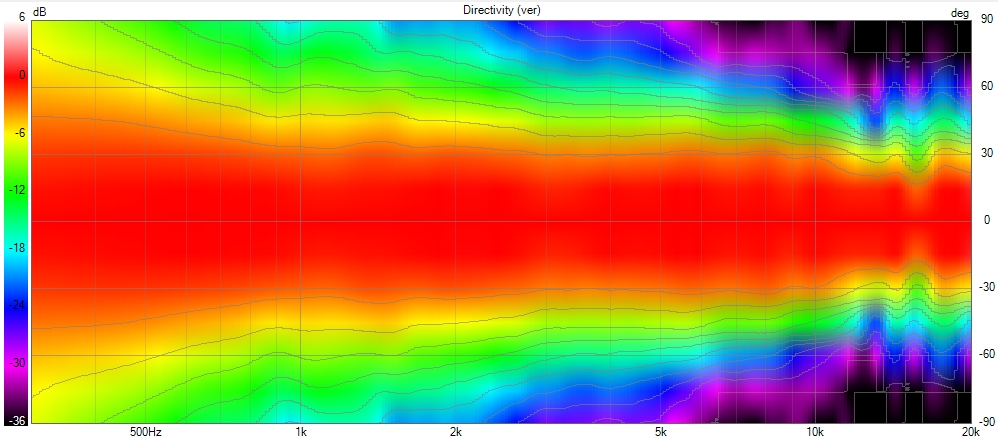
AudioHorn Solution
X-Shape horns and PureShape tweeter waveguide address this problem by focusing on the diagonal transitions.
Using advanced Finite Element Analysis (FEA), a specific diagonal profile is designed to ensure the wavefront maintains its integrity, even along these critical axes.
This allows the wavefront to smoothly follow the curvature without encountering drastic changes in geometry, removing diffraction as we can see here with a polar of the X-Shape diagonal (the worst place to measure a horn) :
![]()
In the world of sound manipulation, both delay and acoustic phase play a vital role, influencing how we hear and experience audio. While often used interchangeably, understanding the distinction between them is key to achieving desired sonic effects.
Delay: A Controlled Time Shift
Delay, in the context of Digital Signal Processing (DSP), refers to the intentional postponement of a sound signal by a specific time interval. Think of a sound wave reaching your ears. With delay, a copy of that wave is electronically held back for a fraction of a second before being released. This creates an echo effect, a delayed replica following the original sound.
Acoustic Phase: The Timing Within the Wave
Acoustic phase, on the other hand, is an inherent property of sound waves themselves. Every sound wave has a cyclical pattern of peaks and troughs, representing areas of high and low pressure. Acoustic phase refers to the specific point within this cycle at which the sound wave begins. Consider two identical sound waves playing simultaneously. If their peaks (or troughs) line up perfectly, they are considered “in phase.” Conversely, if one wave’s peak coincides with the other’s trough, they are “out of phase.”
The Combined Effect on Sound Perception
The interaction between delay and acoustic phase significantly influences how we perceive sound. In-phase sounds tend to reinforce each other, leading to a louder and fuller perception. Out-of-phase sounds can partially or completely cancel each other out, resulting in a quieter or thinner sound.
As an example: Two speakers playing the same sound, but one speaker experiences a slight delay compared to the other. Depending on the delay time and the specific frequencies involved, the sounds from the speakers may combine constructively (in-phase) or destructively (out of phase). This can lead to comb filtering, where certain frequencies are boosted while others are attenuated, creating an uneven tonal response.
The Interplay in Crossover Design
In crossover design, both delay and acoustic phase interact to influence the sound reaching the listener. Here’s how:
-
Phase Alignment: Ideally, at the crossover frequency, the acoustic phases of the woofer and tweeter outputs should be aligned. This ensures their peaks and troughs coincide, resulting in a coherent and balanced sound.
-
Phase Shifts in Filters: Crossover filters inherently introduce phase shifts at different frequencies. By strategically adjusting the delay applied to each driver, we can compensate for these phase shifts and achieve a more linear overall phase response across the crossover region.
The Collaborative Effort
Delay and acoustic phase are distinct concepts, but in crossover design, they work together to achieve a smooth and accurate transition between drivers. By understanding their individual roles and their interaction, loudspeaker designers can optimize crossover performance for a superior listening experience.
![]()
What is “Honk” Sound
The term “honk” in audio is often associated with an undesirable coloration that gives a nasal or hollow character to the sound. This phenomenon can arise from several combined sources:
-
Throat resonances: Unintended resonances within the throat of a horn can introduce peaks in the frequency response, leading to a honky character.
-
Time-domain anomalies: A combination of throat resonance and an abrupt termination of the horn profile can create reflections and energy storage effects, resulting in temporal smearing.
-
Path length differences: A significant delay caused by a long acoustic path in the horn compared to other frequency components can lead to phase cancellation, creating irregularities at the crossover point.
-
Propagation modes in the horn: Certain horn geometries, especially older and curved designs with non-optimized profiles, can support unwanted propagation modes (cutoff modes). These modes interfere with the main signal, introducing frequency and phase anomalies that contribute to a honky sound.
-
Diaphragm breakup: Older compression driver diaphragms exhibited breakup modes at lower frequencies than modern designs, potentially contributing to a honky coloration.
History
At the beginning of the audio industry, amplifiers were unable to deliver significant power. Early tube amplifiers could only produce a few watts:
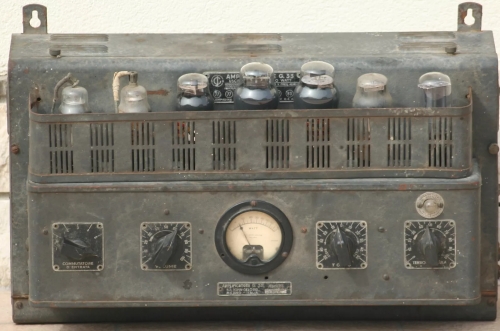
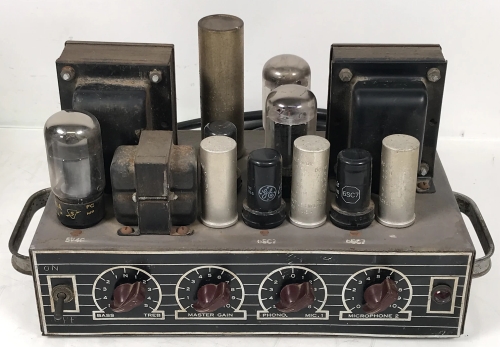
To compensate for this limitation, the audio industry relied on high-efficiency acoustic loading — at the expense of everything else. This focus on maximizing efficiency with a very long throat came with severe trade-offs in linearity, directivity control, resonances, viscothermal losses, higher-order modes (HOM), and increased distortion at high frequencies — together, these phenomena can be perceived as “Honk”.
This approach also led to significant compromises in overall sound quality and directivity control.
A prime example is the Western Electric 15A, introduced in the 1920s:
With measurement and distortion at 90dB SPL at 1m with a Lamar compression driver:
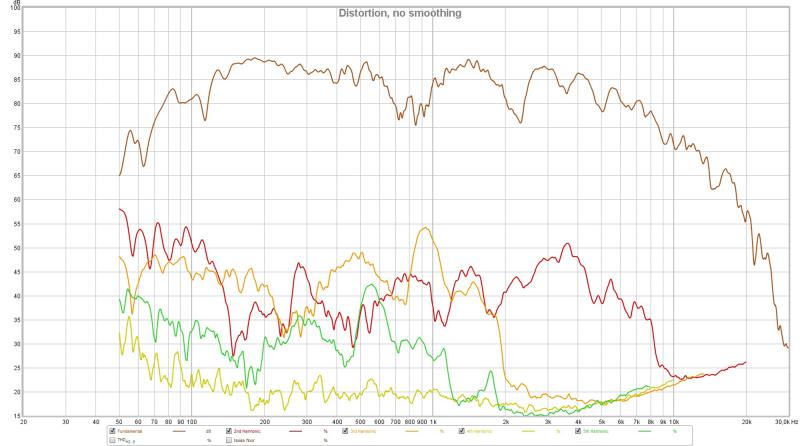
Over time, this early limitation wrongly became a defining trait of all horn-loaded systems, giving rise to a persistent and unfounded cliché. Despite decades of advancements in horn design, many still associate horns with this outdated flaw, even though modern designs have completely eliminated the causes of “honk.”
How Audio Solved It
The issues that caused the “honk” sound a century ago have been progressively eliminated thanks to technological advancements. Key improvements include:
-
Amplifier advancements: With the transition from low-power tube amplifiers to Class AB and now Class D, power is no longer a limiting factor. We can now use the adapted horn loading, optimizing horn throat design while respecting wavefront propagation.
-
Finite Element Analysis (FEA) and simulation: Modern modeling tools allow engineers to simulate wavefront behavior with precision, ensuring optimal throat shaping and loading without introducing unwanted artifacts.
-
DSP and active filtering: Digital processing has definitively solved the delay issues between components, making phase alignment and crossover transitions seamless.
-
Fluid horn profiles: These advanced geometries eliminate throat resonances, further enhancing clarity and accuracy in sound reproduction.
-
Improved compression drivers: Innovations in diaphragm materials, surround design, and phase plugs have pushed time-domain issues far beyond the range of human hearing, effectively eliminating artifacts associated with older designs.
-
Better understanding of wavefront behavior and directivity: Over the years, extensive research has deepened our knowledge of how wavefronts propagate within horns, helped by FEA. We now fully understand the importance of directivity matching between drivers to ensure a smooth frequency response tansition at crossover and avoid accidents at the crossover region.
The Role of Crossover Optimization and Directivity Matching
A common misconception is that midrange crossovers inherently degrade sound quality.
However, modern design techniques ensure that, when properly implemented, crossovers pose no issue. By precisely controlling:
- Delay
- Phase alignment
- linear SPL
- Crossover frequency chosen considering distortion and directivity matching
- Proper and stronger slope
Properly implemented systems achieve seamless transitions between drivers without introducing audible artifacts.
One crucial aspect often forgotten is directivity matching at the crossover point. If the directivity patterns of adjacent drivers do not align properly, this can lead to a perceived “empty midrange,” where energy is either lost off-axis or becomes accidented.
By carefully designing the crossover region to maintain a consistent radiation pattern, we ensure a smooth and natural transition across the frequency spectrum.
Today’s tools, such as VituixCAD and REW, allow for advanced crossover simulation, measurements and optimization of crossover design including directivity match, ensuring perfect integration between components. Thanks to these technologies, crossover points in the midrange are no longer a limitation but rather an integral part of achieving optimal performance.
Conclusion
The so-called “honk” sound was a byproduct of early horn-loaded systems, where efficiency was prioritized over all other design considerations due to amplifier power limitations. These compromises led to resonance issues, poor directivity control, and time-domain distortions that reinforced the negative perception of horns.
However, modern advancements in amplification, simulation, DSP, horn geometry, and compression driver technology have completely eliminated the root causes of “honk”. Today, properly designed horn-loaded systems benefit from optimized throat loading, controlled directivity, and seamless crossover transitions. Software like VituixCAD ensures precise phase alignment, time correction, and directivity matching in crossovers, making them transparent and free of artifacts.
In short, “honk” is a relic of the past, a problem solved long ago. Properly implemented horn designs now offer high efficiency, controlled dispersion, and accurate sound reproduction without compromise.
The outdated cliché of honky horns persists, but the reality is that modern constant directivity horn systems, when properly designed with loading capacity as we do, achieve unmatched linearity, phase coherence and neutrality, setting the benchmark for high-performance loudspeaker design.
![]()
Demystifying Directivity Match
In the world of loudspeaker design, achieving a seamless transition between different driver components is crucial for optimal sound quality.
This article delves into the intricacies of directivity matching between horns or waveguides, and woofers, a process that ensures a cohesive and natural listening experience.
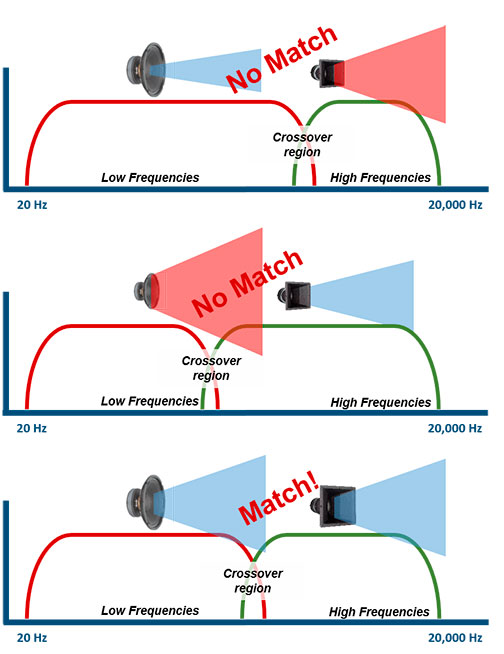
The Importance of Directivity Match
When designing a loudspeaker that combines a woofer with a horn-loaded or waveguided high-frequency driver, one critical aspect is matching their directivity patterns around the crossover region.
Each direct radiation driver has its own transition frequency, the frequency at which the loudspeaker’s directivity changes from wide (omnidirectional) dispersion to narrower, more focused dispersion due to the physical size of the source. This transition frequency is roughly estimated by the formula f = c / (2πR), where R is the effective radiating radius.
Understanding Cone Radiation Directivity
There are two main stages of diaphragm – or cone driver – behavior as frequency increases: pistonic motion and non-pistonic motion.
At low frequencies, the diaphragm moves uniformly in pistonic motion, radiating sound broadly and evenly.
As frequency rises, the size of the radiating surface becomes comparable to the wavelength, causing phase differences (delays) between the diaphragm center (driven by the voice coil) and its edges. These phase shifts lead to a progressive narrowing of directivity.
This transition from pistonic to non-pistonic motion primarily results from geometric and wave propagation effects across the diaphragm surface, and it occurs even if the diaphragm material were perfectly rigid.
Material properties like stiffness and damping can also influence diaphragm behavior but have a lesser impact on directivity compared to the geometric phase effects.
This narrowing of directivity is the reason why the crossover to the high-frequency driver is usually placed around that frequency, so that both drivers have matching directivity for a smooth sound transition.
The size and shape of the baffle also affect this directivity transition.
This transition frequency f_transit can be approximated by:
f_transit ≈ c / (2 π R)
where c is the speed of wave propagation in the diaphragm material, and R its radius.
Why Directivity Match Matters
At the crossover frequency (close to the transition frequency), the directivity of both drivers should ideally match to ensure a smooth spatial response.
Without this match, response dips appear off-axis, degrading the coherence of the reproduced soundstage.
Even when listening on-axis only, the reverberated energy — shaped by off-axis radiation interacting with room acoustics — plays a significant role in the perceived sound.
This is because, at typical listening distances around the critical distance, the sound reaching the listener is approximately a 50/50 mix of direct sound from the speaker and reverberated sound reflected by the room.
If the woofer’s directivity narrows too much in the crossover region, it emits little energy off-axis in that frequency range. As a result, the room receives less energy in this midrange band, creating an energy dip in the perceived sound and a sensation of an “empty midrange.”
This interplay between directivity and room reflections makes directivity matching crucial for natural tonality, clarity, and spatial coherence.
Acoustic Center Distance
Another key factor is the physical distance between the acoustic centers of the woofer and the high-frequency driver.
Ideally, this spacing should be less than or equal to 66% of the wavelength at the crossover frequency — a topic we cover in more detail in our vertical lobing article.
Minimizing this distance helps maintain vertical consistency, reducing lobing artifacts and further reinforcing the perception of a seamless transition between drivers.
Empty Midrange Feeling
Some mid-woofer drivers, such as those from PURIFI, have excellent distortion performance. This often makes it tempting to push their usable range higher than usual.
However, as previously discussed, a woofer’s directivity narrows as frequency increases.
For example, an 8-inch woofer becomes too narrow in dispersion after around 1200–1300 Hz to blend properly with a wide-dispersion device like an AMT or a direct-radiating tweeter.
Using such a crossover point leads to a poor directivity match: at crossover, the tweeter still radiates energy widely off-axis, while the woofer no longer does.
The result is a significant mismatch in how sound is distributed in space.
This isn’t visible in the on-axis frequency response but becomes obvious in polar plots and, more importantly, audible in the room.
It can produce what many describe as an “empty midrange” — not because those frequencies are absent on-axis, but because the woofer no longer emits energy off-axis in that range.
As a result, the room does not reflect those frequencies back to the listener as it does for lower or higher bands, creating a dip in perceived energy and listener envelopment in the midrange.
In other words, it’s the interaction between the woofer’s narrowing directivity in the crossover region and the room’s reflective field that creates this perceptual gap.
Using Midrange Narrowing as a Directivity Tool
Midrange Narrowing is often perceived only as a flaw to be avoided.
However, in the specific case of woofer-to-horn transitions, it can also be deliberately used as a directivity-shaping mechanism, provided its frequency placement is carefully controlled.
For a mid-woofer, directivity naturally narrows as frequency increases due to its finite radiating diameter.
The baffle itself contributes to this behavior: a cabinet that is just wide enough to house the woofer introduces a predictable midrange narrowing related to edge diffraction.
When this narrowing is intentionally positioned near the crossover frequency, it can reinforce the woofer’s natural directivity transition.
In this configuration, the combined effect of:
- the woofer’s geometric directivity,
- and the baffle-induced midrange narrowing,
allows the woofer’s polar response to approach that of the horn at crossover, improving directivity matching.
If the baffle is made too wide, this narrowing shifts to a lower frequency, creating a mismatch as the woofer does not become directive enough and a visible directivity anomaly appears just below the crossover frequency. Conversely, a well-proportioned enclosure enables a smooth and progressive narrowing that aligns with the horn’s intended coverage.
This approach is specific to woofers and mid-woofers.
For horns, waveguides, and tweeters, midrange narrowing must instead be minimized or eliminated, as their directivity is already defined by geometry and should remain stable through the crossover region.
The Wide Perfect Match: A Myth?
The pursuit of a wide directivity match on all the bandwidth at all frequencies, can be a misguided approach.
The crossover slope, along with meticulously adjusted time delays, plays a vital role in ensuring a smooth transition between the woofer’s coverage and the horn/waveguide’s coverage. This transition should be free of abrupt changes (on-axis or off-axis) to avoid unwanted coloration or distortions in the sound.
Moreover, a common misconception in modern loudspeaker design is prioritizing an exact 120-degree directivity match at crossover and with all frequencies on the depends of more important aspects like coverage adapted to listening distance.
This “one-120°-coverage-fits-all” approach leads to completely ignores psyckoacoustics principles and coverage adapted to distance as see in critical distance article.
Improved Directivity with Round-Over Returns
Our horns incorporate a design element called a “round-over return.” This feature enhances directivity control by mitigating the narrowing effect call midrange narrowing/beaming that occur in the midrange frequencies.
The round-over return is a smooth, curved transition that seamlessly follows the horn’s profile until it meets the side of the enclosure. This design minimizes disruptions to the wavefront, preventing unwanted narrowing of the sound dispersion pattern in the midrange.
Benefits of Round-Over Returns:
-
Improved Directivity: By eliminating midrange narrowing, the round-over return ensures a more consistent and predictable directivity pattern across the entire frequency spectrum.
-
Smoother Sound Transition: The smooth curvature of the return minimizes potential phase cancellations and contributes to a more natural and seamless transition between the horn and the enclosure.
-
Enhanced Off-Axis Response: The improved directivity control translates to a more consistent tonal balance thanks to coherent power response (the fusion of direct and reverberated field as seen upper), for listeners positioned both on and off-axis from the speaker.
Directivity Matching Between Horns: A Different Approach
When dealing with multiple horns or waveguides in a loudspeaker design, the crossover approach differs slightly. Here, the ideal crossover point is not where each component loses its directivity, but rather where both maintain a constant directivity pattern. This constant directivity should be consistent not only at the crossover frequency but also one octave below and one octave above the crossover point.
Following these principles of directivity matching ensures a natural and cohesive sonic experience for the listener, free from unwanted artifacts and with a smooth transition between different driver components within a loudspeaker.
![]()
When sound travels from your speakers, it bounces off nearby surfaces. Reflections from the floor and ceiling, in particular, can significantly impact the overall sound you hear. These reflections arrive slightly later than the direct sound from the speaker, creating a phenomenon known as comb filtering.
Comb filtering essentially adds and subtracts certain frequencies at specific points in the listening area. This can lead to uneven tonal balance, with some frequencies being boosted and others being cancelled out.
How Directivity Affects the Bounce
The way a speaker distributes sound (directivity) plays a big role in how susceptible it is to floor and ceiling bounce.
Speakers with narrow vertical dispersion tend to excite less the rebound, minimizing the impact of reflections from above and below.
Total Early Reflection (TER) and the Room Equation
While speaker manufacturers typically provide a frequency response curve showing a speaker’s output at different frequencies, this is usually measured in an anechoic chamber – a special environment designed to absorb sound reflections. In a real room, reflections from the floor, ceiling, and walls significantly impact the sound you hear.
Total Early Reflection (TER) is a crucial concept that helps us understand this real-world sound experience. TER specifically measures the combined effect of the first reflections that arrive at the listening position after bouncing off nearby surfaces. These early reflections can significantly alter the tonal balance and overall clarity of the sound.
Evolutionary Adaptation and the Human Auditory System
Interestingly, our brains have likely adapted to compensate for the effects of room acoustics to some extent. For millennia, since the days of Homo sapiens living in caves, our auditory systems have been processing sound in environments with reflections.
This means our brains may be able to partially “correct” for some of the coloration caused by floor and ceiling bounce.
Crossover Design and Minimizing Interference
Another factor to consider is speaker crossover design. A crossover is a circuit that divides the audio signal into different frequency ranges and directs them to the appropriate speaker drivers (woofer, tweeter, etc.).
When the crossover frequencies are close to the resonant frequencies caused by floor bounce, it can be use, by looking power response, to diluate the bounce effect by taking account in crossover design.
Imagine two drivers in a speaker – one positioned higher and one positioned lower. If they are reproducing similar frequencies at the same time, but one is slightly delayed due to its distance from the floor (floor bounce), they can interfere with bounce effect differently.
Crossover design can plays a role in minimizing the impact of floor bounce. While the height difference between drivers can cause slight phase delays, a well-designed crossover can address this. By analyzing the power response, the crossover can be designed to “dilute” the bounce effect, reducing unwanted reflections but it shouldn’nt be done at the expense of putting mid-woofer/woofer as close at possible of tweeter section.
Taming the Bounce: Achieving Optimal Listening
By understanding the effects of floor and ceiling reflections, directivity, power response, and even our own evolutionary adaptations, we can achieve a more balanced and enjoyable listening experience in any room. Here are some tips:
-
Speaker placement: Experiment with speaker positioning relative to the walls and your listening area. Even a few inches can make a difference.
-
Room treatments: Consider acoustic panels or diffusers to absorb or scatter sound reflections, especially if your room has hard, reflective surfaces.
-
Understanding crossover design: While not directly controllable by the listener, being aware of how crossover design can minimize interference due to floor bounce can be helpful when choosing speakers but it must not be done on the depend of the point below.
-
Lower crossover frequency: As mentioned earlier, a lower crossover encourages the woofer to handle a wider range of frequencies at lower wavelengths. This promotes better directivity at the lower frequencies most susceptible to floor bounce, reducing the overall energy bouncing around the room.
-
Narrower vertical dispersion: Speakers with wider vertical dispersion spread the sound out more, which can actually increase reflections off the floor and ceiling. Conversely, speakers with narrower vertical dispersion tend to focus the sound more towards the listening area, minimizing the interaction with reflective surfaces above and below. It’s one of the raison that the coverage should be choosen according to listening distance and acoustic.
![]()
Introduction
The way a loudspeaker is mounted — free-standing or flush-mounted in a wall — has a major influence on its directivity behavior, particularly around the crossover region.
Proper directivity matching ensures that the woofer is crossed over when it becomes sufficiently directive, while the horn or waveguide is crossed over when it starts to lose its controlled directivity, creating a smooth and coherent transition between the two drivers.
An oversized cabinet or a rigid in-wall installation can widen radiation at the crossover frequency, making proper directivity matching with a horn extremely difficult, and can degrade directivity control below this region until wavelengths become sufficiently large.
This article focuses on understanding these mechanisms and identifying practical solutions.
1. Free-Standing Case
Smooth horn and waveguide design
For horns and waveguides, the profile must be smooth and continuous along the axis of wave propagation.
Rounded edges and the absence of abrupt depth changes ensure a consistent progression of the wavefront and stable directivity, midrange narrowing must be avoided.
Woofer directivity and baffle size
In the case of a woofer, its directivity can approximate that of a similarly sized horn at crossover if the enclosure is just large enough to house the driver.
This is the key design principle: the cabinet should not be oversized. By limiting the baffle width, the resulting midrange narrowing occurs at the intended frequency,
allowing it to cooperate with the woofer’s natural directivity transition.
In this specific case, crossed with a 90° horn, the cabinet does not need a roundover. Leaving the corners sharp or minimal (without rounding or 4mm) will be advantageous, as it allows us to exploit edge diffraction to complement the horn’s natural directivity.
A properly sized baffle ensures that:
- The midrange narrowing occurs where the woofer starts to become directive,
- The woofer’s polar response aligns smoothly with the horn’s controlled directivity at crossover,
- Directivity match is optimized without introducing wavefront distortions or frequency shifts.
If the baffle is made too large, the midrange narrowing shifts to a lower frequency, the woofer does not become directive enough at the intended crossover, and optimal directivity matching with the horn becomes impossible.
Wavefront distortions with oversized baffles
At mid and high frequencies, an oversized baffle distorts the wavefront leaving the driver.
Part of the sound propagates at very shallow angles along the baffle surface (quasi-lateral wave), while abrupt edges excite evanescent near-field components.
Their interaction with the main propagating wave alters the overall wavefront, resulting in uneven radiation and degraded directivity
until the wavefront becomes dominated by wavelengths larger than the baffle, at which point these distortions gradually vanish.
Matching woofer and horn directivity
The directivity of a mid-woofer evolves with frequency:
- At low frequencies, radiation is wide and close to omnidirectional.
- As frequency increases, directivity narrows progressively as the effective radiating diameter becomes limiting.
By ensuring the baffle is just large enough for the woofer, the midrange narrowing occurs at the intended frequency, cooperating with the woofer’s natural directivity transition.
This allows the woofer’s polar response to blend smoothly with the horn’s directivity at the crossover, achieving a predictable and coherent directivity match.
2. In-Wall Case
Directivity behavior in wall installations
When a loudspeaker is flush-mounted in a rigid wall, radiation is confined to a half-space (180° hemisphere, or less in corners).
This increases output at very low frequencies, but around the crossover region it often creates a severe directivity mismatch.
In this configuration, the woofer’s radiation becomes wider than in free-standing conditions and typically wider than the horn’s controlled directivity (often around 90°), resulting in an uneven directivity index transition.
Note: An in-wall installation does not remove the need to aim the speaker toward the listening position.
The front wall must be shaped accordingly; a flat wall is not sufficient.
Wavefront behavior with a hard wall
When a waveguide is flush-mounted in a rigid wall, the wavefront does not detach cleanly into space.
Three contributions coexist:
- the main propagating wave,
- a quasi-lateral wave traveling along the wall surface,
- evanescent near-field components excited by opening edges (including those of the woofer itself).
Their interference alters the phase and curvature of the wavefront, producing irregular radiation and directivity anomalies.
The observed directivity anomalies in rigid in-wall installations are caused by the combined interaction of propagating and non-propagating wave components near the mounting surface.
Evanescent near-field components are generated at sharp impedance discontinuities such as waveguide terminations, driver apertures, and cabinet or woofer edges. Although these components do not propagate into the far field on their own, they modify the local pressure and particle velocity distributions near the wall. When coupled to a rigid boundary, they can partially convert into propagating energy at larger distances, altering the effective phase and curvature of the radiated wavefront.
In addition, the woofer’s initial wavefront contributes to these anomalies. Its near-field radiation is not a well-defined planar wave; local pressure and velocity variations, arising from diaphragm motion, geometry, and driver-edge discontinuities, coexist with a chaotic, quasi-reactive region immediately in front of the driver, a non-radiative zone where the acoustic field is not yet fully propagated, with pressure and particle velocity out of phase, and where energy is partially stored rather than radiated efficiently.
Note: this aspect also makes designing a woofer waveguide challenging, because the waveguide sees the near-field wavefront before it reaches the Fresnel region, where the front is highly non-uniform and varies with frequency.
In an in-wall installation, these irregularities interact with the evanescent components and quasi-lateral waves, amplifying directivity anomalies even when the cabinet front is flush.
In parallel, quasi-lateral waves are excited along the rigid wall surface due to the strong acoustic impedance contrast between air and the boundary. These waves are neither purely standing waves nor free-field radiation. They are guided surface-related modes that transport energy laterally before re-radiating into the listening space. Their delayed and frequency-dependent re-radiation interferes with the main wavefront, producing lobing, angular irregularities, and non-monotonic directivity index behavior.
These effects become most pronounced when the natural directivity of the radiator becomes narrower than the hemispherical radiation imposed by the wall. In this regime, the wavefront cannot detach cleanly from the surface, and the wall enforces an artificially wide radiation pattern that contradicts the source’s inherent directivity. The result is not simple midrange beaming or diameter-related narrowing, but an unstable transition dominated by boundary-induced wave phenomena.
Moreover, the rigid wall forces the woofer to radiate over a wider angle near the crossover region. As a result, its directivity can exceed that of the horn at the crossover frequency, making the transition region prone to off-axis irregularities.
As frequency decreases and wavelengths become much larger than the source, these effects progressively vanish and radiation approaches ideal half-space behavior at very low frequencies.
The constricted radiation gain provided by the wall, from 4π to 2π for example, occurs only when the natural radiation of the driver is wider than the available aperture of the wall, typically at low frequencies.
When the natural directivity at a given frequency becomes narrower than the hemispherical radiation (~180°) imposed by the mounting surface, the wavefront must detach and radiate freely into half-space.
If the wavefront cannot detach properly at that point, the wall forces an artificially wide radiation pattern, reintroducing the very mechanisms described above: quasi-lateral waves, evanescent near-field components, and severe directivity irregularities.
Solution: Acoustic absorber wall
For stable directivity, the wavefront must detach and radiate freely into half-space at the appropriate frequency.
This is achieved by using absorptive or porous materials around the horn and a relatively thin woofer enclosure, providing an acoustic impedance closer to that of air.
Such treatment suppresses lateral wave propagation and evanescent components, leaving only the main propagating wave to define directivity.
The front wall should be flush with the enclosure and acoustically absorptive, which not only stabilizes directivity, but also improves the room’s acoustic behavior.
It will also help, as in a free-standing ideal implementation (see above), to preserve the directivity match between woofer and horn, as the wavefront can beam naturally and combine with the woofer’s inherent directivity to reach the horn’s radiation at the intended frequency.
If this cannot be achieved, a free-standing configuration respecting proper baffle dimensions will generally yield better results, as the room or wall cannot reliably act as a horn except in the very low frequency range.
Conclusion
Mounting conditions have a critical impact on loudspeaker directivity, particularly around crossover frequencies.
Free-standing designs with well-proportioned baffles allow controlled use of midrange narrowing for directivity matching, while in-wall installations require careful absorptive treatment to avoid severe radiation anomalies.
Horn Loading and Efficiency
Horn loading is a technique used in loudspeakers to improve efficiency by shaping how sound is transferred from the driver to the surrounding air. This article explores the different aspects of horn loading, its frequency dependence, and its relationship with directivity and wavefront geometry.
We will expose technical considerations necessary for a full understanding of the phenomenon, then present a conclusion.
Acoustic Impedance
Acoustic impedance (Z) is defined as the ratio of sound pressure (Pa) to particle velocity (v):
Z = Pa/v
It characterizes how easily an acoustic wave propagates through a medium or across a boundary between two media. In practice, acoustic impedance measures the adaptation between two acoustic environments, such as a loudspeaker coupling into a room, or a compression driver coupling into a horn.
Acoustic impedance is not directly audible. Instead, it governs how much of the acoustic energy is transmitted versus reflected at a boundary. A well-matched acoustic impedance maximizes energy transfer and minimizes unwanted reflections.
In horn-loaded loudspeakers:
- At low frequencies, where the wavelength is larger than the horn dimensions, the horn does not load efficiently and the acoustic impedance mismatch leads to reduced efficiency.
- At mid frequencies, the horn improves the impedance match, thereby boosting efficiency.
- At high frequencies, the impedance tends to rise again due to smaller wavelengths and internal viscous losses, reducing the overall gain.
Additionally, directivity impacts impedance: as a source becomes more directional (naturally or by design), the radiated impedance increases. Horns use this effect intentionally to “concentrate” the energy, but it must be controlled to avoid creating too much mismatch at the horn mouth.
Finally, acoustic impedance at the horn throat typically increases with frequency, and a very high impedance combined with high particle velocity can lead to thermal compression and distortion at high SPL levels.
With a horn featuring a smooth roundover at the mouth to avoid midrange narrowing, the acoustic impedance at the horn’s mouth approaches that of free air—very low and nearly linear—while the horn geometry progressively transforms this impedance towards the throat, ensuring efficient coupling with the driver.
Acoustic impedance is a complex quantity, comprising both resistive (dissipative) and reactive (energy-storing) components.
The horn influences both parts, but the reactive load is especially important as it temporarily stores and releases acoustic energy, shaping the frequency response and directivity of the system.
Reactive Loading
Reactive loading refers to the non-dissipative component of acoustic impedance — the portion that stores, rather than dissipates, energy.
In an acoustic system such as a horn, certain elements — like the confined volume of air near the throat — behave somewhat like a spring or a mass, temporarily storing energy in the form of potential or kinetic energy without dissipating it.
This reactive impedance resists rapid changes in pressure or displacement and varies with frequency.
At low frequencies, the confined air acts as an acoustic compliance (spring), increasing the total acoustic impedance and improving energy transfer from the driver to the air.
At high frequencies, this effect decreases, as the wavelength becomes shorter and the confined air no longer behaves as a significant reactive load.
In short, reactive loading is the frequency-dependent acoustic impedance caused by the storage of elastic energy in the air near the throat (and other regions), which helps match the transducer to free air — especially at low frequencies.
Particle Velocity
Particle velocity (v) is the oscillating motion of air particles caused by a sound wave. It differs from the speed of sound (celerity), as it describes the back-and-forth movement without any net displacement.
In audio systems:
- High particle velocity typically occurs in constricted areas, such as bass reflex ports, narrow ducts, or horn throats.
- At constant sound pressure, higher particle velocity means lower impedance.
- In general, as the cross-section narrows, the particle velocity rises, even if the frequency or SPL remains constant.
Thus, particle velocity must be carefully monitored when designing small apertures or highly compressed structures to avoid excessive velocities that cause distortion and energy losses; controlling it properly helps minimize nonlinear distortion and maximize power handling.
These nonlinear effects extend beyond simple harmonic distortion — they also generate intermodulation distortion, which arises from the interaction of multiple frequencies. Intermodulation distortion particularly degrades clarity and precision, adversely affecting the perceived fidelity of the sound.
The particle velocity within the throat limits the maximum power the horn can handle. This is why compression horns often feature throats with an optimized diameter — to control particle velocity, reduce turbulence and flow losses due to viscous and thermal boundary layer effects at the throat walls, and prevent the flow from exceeding the critical Mach threshold.
However, modern phase plugs allow for much higher compression ratios by ensuring equal impedance across each acoustic path.
This design distributes particle velocity more evenly, reducing local velocity peaks and enabling greater power handling without increased distortion, or allowing a smaller throat size to extend directivity control to higher frequencies without sacrificing maximum power.
Critical Mach Number
The critical Mach number describes when the particle velocity becomes a significant fraction of the speed of sound (Mach 1). In loudspeaker design, this is particularly relevant in narrow passages or throats where particle velocity can increase substantially.
The Mach number is defined as:
M = v/c
Where:
- v is the particle velocity,
- c is the speed of sound in the medium (≈ 343 m/s in air).
At a Mach number of around 0.1 to 0.3, the acoustic behavior starts to become nonlinear. Exceeding this critical Mach number results in:
- Strong nonlinearities (distortion),
- Turbulent flow,
- Thermal compression (heating due to intense localized motion),
- Potential efficiency loss and audible degradation.
Keeping particle velocity well below the critical Mach number ensures low distortion and optimal efficiency in horn-loaded designs.
For ports, we have developed a flat velocity port that allows us to keep the Mach number low.
How These Concepts Interact with Frequency
The interaction between reactive loading, acoustic impedance, particle velocity, and the Mach number depends strongly on frequency.
-
At lower frequencies, reactive loading dominates. The confined air near the horn throat acts as an acoustic compliance, temporarily storing energy and improving energy transfer from the driver to the air. Sound waves have longer wavelengths, which results in lower particle velocities, reducing the risk of reaching the critical Mach number. Horn-loaded systems generally handle these frequencies efficiently, with minimal distortion or turbulence, benefiting from the positive effect of reactive loading.
-
At higher frequencies, wavelengths become shorter and particle velocity increases more rapidly. In narrow openings, such as the throat of a horn or the port of a bass reflex system, the risk of exceeding the critical Mach number rises. This can cause distortion, thermal compression, and reduced efficiency.
In practice, these effects occur mainly at very high SPLs or with extremely narrow throats. Modern phase plugs and impedance-optimized designs help manage airflow, reducing peak particle velocities and mitigating nonlinearities, while still allowing efficient sound radiation.
Proper impedance matching remains essential in horn design to minimize reflections and ensure optimal energy transfer. At higher frequencies, impedance tends to increase at the throat due to viscous and thermal losses, which can partially offset the efficiency gains from the horn.
In summary, frequency, horn geometry, throat size, and intended SPL all contribute to the balance between reactive loading, particle velocity, Mach number, and impedance. Understanding these interactions is key to achieving optimal performance across the horn’s operating range.
High-Order Modes (HOMs) in Horns
High-Order Modes (HOMs) are unwanted sound waves that can occur within a horn due to its geometry.
They deviate from the ideal plane wave propagation, causing peaks and dips in the frequency response as well as localized internal resonances.
These resonances affect directivity and linearity, coloring the sound and compromising acoustic neutrality and transparency.
Minimizing HOM Excitation
A well-designed horn aims to:
- Maintain a flat impedance profile across the desired frequency range. This helps to suppress the excitation of HOMs.
- Have a smoothly expanding horn throat to encourage the propagation of the fundamental wave mode (desired sound wave) and discourage the excitation of higher-order modes.
Influence of Throat Geometry and Mass Corner on Horn Loading
The way a horn loads the driver is primarily dictated by the throat design and the expansion profile, but the mass corner of the diaphragm also plays an important role.
-
Throat geometry and expansion: A longer, more constricted throat increases low-frequency loading by enhancing impedance matching at low frequencies. However, this comes at the cost of increased acoustic resistance at higher frequencies, which can reduce efficiency and bandwidth in the upper midrange and treble. Conversely, a rapid flare (wider throat expansion) improves high-frequency performance but sacrifices low-frequency loading because of poorer impedance matching.
-
Mass corner effect: The mass corner defines the transition between compliance-controlled (spring-like) and mass-controlled (inertia-like) behavior of the diaphragm. Above the mass corner, the diaphragm operates in a mass-controlled region where energy transfer into the horn is more efficient. Below the mass corner, the diaphragm becomes increasingly compliance-controlled, making efficient horn loading more difficult.
Thus, horn loading performance results from a combination of throat geometry and diaphragm behavior relative to its mass corner. When experimenting with different throat characteristics, a horn may appear to shift its frequency response at a certain point. This isn’t solely due to the mass corner or the horn’s geometry—it’s the result of both.
In classic direct-radiating loudspeakers with horn-loaded cones, it’s possible to optimize the impedance match between the cone and the horn’s throat by carefully designing the throat profile, like with a compression driver, thus minimizing efficiency loss around the mass-controlled transition while maintaining good loading.
Impedance Matching and Low-Frequency Considerations
For a cone driver in a horn-loaded speaker, impedance matching between the diaphragm and the throat is crucial, especially at higher frequencies, as this helps maximize SPL and minimizes energy losses due to reflections.
However, as frequency decreases toward lower midrange and bass regions, impedance matching becomes less critical for the following reasons:
-
Longer wavelengths allow the throat to behave more “linearly” at lower frequencies.
-
Acoustic resistance of the throat becomes less significant at lower frequencies, as pressure variations are smoother and energy propagates better over longer wavelengths.
-
The horn’s low-frequency loading effect becomes more dominant, and impedance matching has less impact.
In summary:
-
At high frequencies, proper impedance matching between the diaphragm and the throat is crucial for efficient energy transfer, minimizing reflections, and maintaining consistent frequency response.
-
At low frequencies, imperfect impedance matching has a reduced impact on efficiency. Horn design at these frequencies is more concerned with maximizing acoustic loading and maintaining extension, rather than achieving a perfect impedance match.
How a Horn Increases Efficiency at Low Frequencies
The loading of a horn depends on several factors, including:
-
Horn Geometry: The geometry of the horn, particularly the throat design and the expansion profile, strongly affects the acoustic loading and impedance matching. Surface propagation and horn depth also play a role, but the throat shape and expansion law are the primary factors.
-
Mouth Size and Directivity Control: The size of the horn mouth largely defines where directivity control ends, particularly in the horizontal plane. If the horn loses control in the vertical plane too early, a portion of the acoustic energy can be lost or dispersed unpredictably, leading to reduced efficiency.
-
Frequency of the Sound: Frequency fundamentally influences how the horn interacts with air impedance and controls sound radiation. Lower frequencies require larger horns to maintain good loading and directivity.
Here’s a breakdown of the key points:
-
Acoustic Loading: A horn acts as an acoustic transformer, influencing the acoustic impedance “seen” by the compression driver. This allows for a better match between the driver’s impedance and the horn’s impedance profile across the desired frequency range, improving efficiency and sound radiation characteristics.
-
Low Frequency Efficiency: At low frequencies, the impedance mismatch between the driver diaphragm (high impedance) and the air (low impedance) hinders efficient energy transfer.
-
Matching the Air Load for Efficiency: Air has a relatively low acoustic impedance compared to the diaphragm of a compression driver. This impedance mismatch can lead to inefficient energy transfer from the driver to the air. A well-designed horn can influence the impedance profile “seen” by the driver, particularly at low frequencies. This allows for a better match between the driver’s impedance and the radiating medium (air). This improved impedance match can lead to increased efficiency, allowing the driver to operate with potentially reduced diaphragm movement for the same sound output (dB).
-
Reduced Diaphragm Movement: With improved impedance matching, the driver needs to move less to produce the same sound pressure level at low frequencies. This reduces distortion and improves the overall efficiency of the driver.
Important Note:
This principle primarily applies to low frequencies. At higher frequencies, the horn’s effect on impedance matching becomes less significant, and other factors like diaphragm size and material come into play.
The “loading effect” is frequency-dependent. It has a stronger influence at lower frequencies and gradually diminishes as frequency increases.
For more information on energy distribution in horns, see : Horn and energy
A point about Constant Directivity Horns:
Since energy isn’t “free,” a constant directivity horn redistributes some of it off-axis to maintain consistent coverage. As a result, the on-axis response often shows a dip or a broad bell-shaped curve.
Conclusion
Importance of Throat
Building on the concepts developed in this article, it becomes clear that a deeper horn — meaning one with a longer throat before the flare — significantly improves acoustic loading in the lower portion of its usable bandwidth.
At higher frequencies, where wavelengths are shorter, this reactive loading (i.e., frequency-dependent impedance due to stored acoustic energy, like air mass or compliance near the throat) diminishes, reducing the acoustic impedance and therefore the loading effect.
At low frequencies, horn efficiency is largely driven by the acoustic loading effect at the throat. This occurs because, at these frequencies, the acoustic wavelength is large compared to the throat dimensions, causing the confined air near the throat to behave as a reactive element — primarily as acoustic compliance and inertance — which increases the acoustic impedance seen by the driver.
This impedance rise at low frequencies enhances energy transfer by better matching the high impedance of the transducer diaphragm to the very low impedance of open air — a transformer effect provided by the horn.
A deeper and properly proportioned throat allows for a more gradual impedance transition, enabling more acoustic energy to be transmitted with less diaphragm excursion. This leads to higher sound pressure levels for the same excursion, reduced reflection losses, and lower particle velocity at the mouth — which limits distortion risks and prevents exceeding the critical Mach number.
This efficiency gain is especially noticeable in the lower range of the horn’s operating bandwidth, where wavelengths are long and direct radiation would be very inefficient without a guiding structure. Horns designed for low-frequency extension often feature a narrow, long, and well-profiled throat. This geometry promotes more stable loading, better efficiency, and reduced distortion.
However, a too long or too narrow throat can cause viscothermal losses, encourage higher-order modes (HOM), generate unwanted transmission line resonances, or increase acoustic resistance and distortion at high frequencies, ultimately degrading the horn’s overall performance. These phenomena, collectively known as “Honk”, primarily degrade efficiency and linearity in the upper frequency range. Therefore, this part of the horn must be carefully designed to balance effective acoustic transition with control of these secondary effects.
Loading and Directivity
Reactive loading is important because it allows the horn’s directivity control band, which remains fixed, to be more effectively filled, while the reactive load itself can be positioned at a specific point within this band. As long as this directivity control is maintained, the energy stored in the reactive load is efficiently transferred into the horn’s radiation and focused along the intended axis. When control is lost, this becomes more noticeable, since energy remains strongly present just above the cutoff frequency, enhancing the perceptual transition.
In other words, horns with a more gradual low-frequency slope are less reactively loaded, whereas horns with higher reactive loading exhibit a sharper fall at the end of the band. This abrupt cutoff provides an appreciable “free” SPL gain just before the limit of control, making these horns particularly effective in extending low-frequency response.
Reactive loading is frequency-dependent, decreasing as frequency increases. This explains why high-frequency points — such as the “anchor point” around 14–15 kHz used for our horn EQ — remain largely unaffected by loading, while still depending on the horn’s directivity behavior.
Another important factor is off-axis energy distribution: at a given frequency, energy radiated off-axis is no longer present on-axis. This is one reason why pursuing constant directivity up to 20 kHz is not necessary, especially when considering audibility thresholds and psychoacoustics.
Non-Uniformity of Loading
It is also critical to understand that loading is not uniform. The combination of expansion geometry and surface area creates a pressure curve over frequency, which interacts with the energy distribution imposed by directivity. This complex interaction defines the range and effectiveness of acoustic loading in conjunction with the driver’s output.
![]()
Horn Response
When looking at a horn’s frequency response, a dip in high frequencies compared to mid frequencies might lead you to believe you’ve “lost” decibels (dB) and need to boost the highs with additional amplification.
However, this way of thinking is not accurate and we will see here why.
To gain a more comprehensive understanding of the concepts discussed here, particularly about horn loading (energy) and constant directivity, we recommend referring to our articles dedicated to these subjects.
Essentially, the bell response of a horn arises from the combined influence of its directivity pattern and acoustic loading effect. While constant directivity horns typically maintain a consistent directivity behavior up to around 7-8 kHz, the acoustic loading effect is inversely proportional to frequency. This means it has minimal impact on high frequencies.
Bell Response and Energy Balance
The interplay between driver characteristics, horn loading and horn directivity creates a phenomenon known as the “bell response”.
This describes a perceived roll-off in high frequencies. However, it’s important to understand that this doesn’t necessarily mean there’s less high-frequency energy overall.
The reasons of the bell response are:
Larger diaphragm compression drivers produce more low-midrange energy compared to smaller ones. So in comparaison the high frequency can look lower than a tinier diaphragm when in fact that is mainly the medium range that is upper.
The horn’s loading effect enhances this low-midrange presence, that is a very important aspect, as the loadding effect is strongly inversely proportional to the frequency, more we goes up in frequency less we have it. So for two horns that are constant at the same frequency, reducing coverage (see the point below) will principaly gives more SPL in low end.
Directivity distribution of the initial energy as we have seen upper, this initial energy will always remains the same, it’s the way to distribute it that change and affect the on-axis response.
This can make the high frequencies seem less prominent in comparison to medium, creating the bell response.
When we see these high frequency lower than medium in comparison we tend to thinks that we have “lost” dB in high frequency, we will see that in fact it doesn’t work like this in Horn Response and Hiss article,
In most cases we in fact have “gain” in the midrange area, it’s the high frequency level that doesn’t have moved.
Flattening Frequency Response with EQ
Typically, to achieve a flat on-axis frequency response, we choose a reference frequency above which we want a flat response. This is often set at 15 kHz.
Beyond this point, we allow the natural roll-off of the driver to occur, or use equalization (EQ) again if there’s a rise.
Negative or positive EQ can be used to achieve a flat response. The direction (positive or negative) isn’t crucial, the final result will be the same.
The primary goal is to avoid clipping (in the source, DSP, or amplifier) and maintain a proper gain structure to our desired maximum power output.
Minimum-phase EQ (IIR) is a valuable tool for correcting on-axis horn response because it addresses both the frequency response and the phase response simultaneously.
When a significant dip or peak occurs at a specific frequency, minimum-phase EQ (IIR) not only corrects the level at that frequency but also adjusts the phase response in a way that complements the level correction. This combined effect helps to achieve a more linear overall frequency and phase response.
Here are two EQ examples for an X-Shape X25 horn
BMS 5530 one:
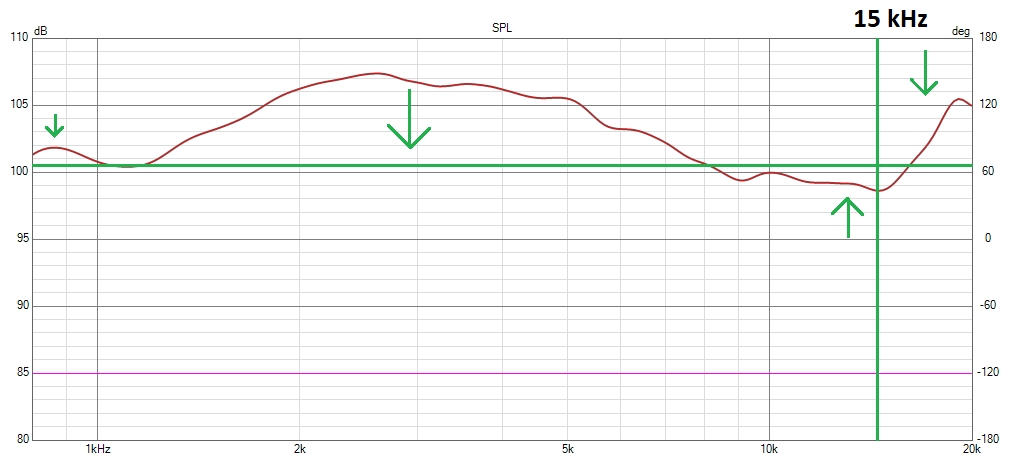
18Sound 1095N one:
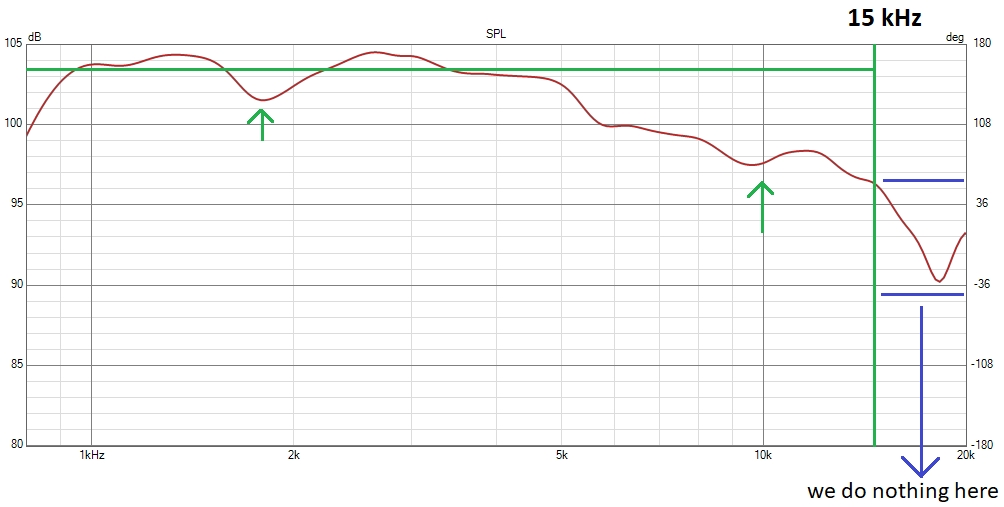
Our article about audibility can help to understand one of the reasons why we do nothing after 15 kHz in the 1095N case.
This region is also where the breakup occurs, that is the second main reason why we don’t try to increase volume here.
In each case 15 kHz is our anchor point, EQ are different but the main judge will be, as alway, the distortion after having EQ it flat below 15 kHz, as we have seen on our 1" compression driver test.
If we push constant directivity very high on the same horn, way after 7/8 kHz, the effective loss of energy in 12/17khz area will be in fact minimal, around 1 or 2dB maximum.
Its due to the fact that only directivity will impact it and not the loading effect.
L-PAD
To reduce hiss and protect the driver, an L-pad to reduce driver sensitivity is often recommended; it’s a simple resistor network placed just before the driver:
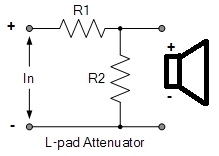
You can simulate appropriate L-pad values using VituixCad, considering the driver’s impedance and the horn on-axis response. For the X25 horn, this might involve a 1.5-ohm resistor in parallel and a 12-ohm resistor in series, depending on the desired dB reduction to match the mid-woofer level.
The L-pad resistor network does not degrade audio quality; it simply absorbs some amplifier energy which therefore does not reach the compression driver or tweeter.
S/N ratio and Hiss
Hiss is a low-level noise often noticeable in high-sensitivity components related to the system’s signal-to-noise (S/N) ratio.
A common concern when comparing horns, especially regarding EQ use, is increased hiss.
It might seem that extensive EQ adjustments, along with the gain changes needed to achieve a flat response,
would increase hiss, reduce S/N ratio, or consume more power.
However, this vision is partial. Here’s why:
-
Power Amplifier: No change in S/N ratio or hiss.
-
Our reference frequency is 15 kHz. Constant Directivity Horns stop exhibiting constant directivity behavior around 7-8 kHz.
-
Therefore, directivity above this point has minimal impact on energy at 15 kHz, which is mostly dictated by the driver.
-
Acoustic loading is inversely proportional to frequency and has almost no influence at 15 kHz.
-
-
DSP: Slight decrease in S/N ratio.
- Extensive EQ adjustments may slightly increase noise as they consume part of the DSP’s dynamic range, but systems typically operate well below their maximum range (around 96-125 dB), so this effect remains minimal.
In conclusion, while EQ adjustments might influence how the DSP perceives the S/N ratio, the impact on hiss is still minimal.
Conclusion
For a given driver, the energy level at 15 kHz is mainly determined by the driver itself, regardless of horn type or coverage area.
Different constant directivity horns generally have similar hiss levels and S/N ratios when using the same driver.
The bell response is not a problem but relates to both directivity and loading effects:
-
It shows the horn is constant directivity; a flatter response may indicate a narrower coverage horn.
-
The loading effect in mid and low frequencies provides an energy “bonus” that reduces overall distortion and allows lower crossover frequencies.
-
EQ adjustments may influence how the DSP perceives the S/N ratio, but impact on hiss is minimal.
-
From the amplifier’s perspective, there’s no change in S/N ratio. Even pushing constant directivity beyond limits reduces it only by 1-2 dB.
-
The L-pad allows for adjusting overall sensitivity and counteracts the amplifier’s inherent noise.
-
Advanced users can use passive equalization (RC networks) to limit EQ application and preserve DSP dynamic range.
-
Effects also depend on compression driver characteristics.
![]()
What is the listener envelopment?
The listener envelopment describes the temporal evolution of sound energy in a room after a sound is emitted.
It’s characterized by the density and distribution of early reflections on surfaces, notably the EDT (Early Decay Time), which measures the initial decay of sound level and directly influences the clarity of the sound. A shorter EDT generally corresponds to greater clarity.
In other words, the Listener envelopment determines how sound propagates and reflects in a space, impacting our perception of the spatialization or extent of a place.
It’s crucial to distinguish this from the overall dynamics, which is the difference between the loudest and quietest sound of an audio signal.
The listener envelopment describes the temporal behavior of the sound energy, while dynamics describe the level variations.
Listener envelopment measurements and studies are relatively new, and this article can be updated.
Factors influencing the listener envelopment
-
Early reflections (EDT): Early reflections, which occur on the room’s surfaces, play a crucial role in the perception of spatialization.
These reflections arrive shortly after the direct sound. EDT (Early Decay Time) refers to the time it takes for the sound level in the room to decrease significantly after the sound source has stopped emitting.
A short EDT corresponds to a rapid reduction in sound energy, which contributes to better clarity, as the early reflections are absorbed or diffused quickly.
A long EDT creates a more enveloping sensation, as the lingering reflections help enrich the perception of the space.More details : Clarity, EDT and ITDG
The pattern and timing of these early reflections are critical for envelopment. Too few reflections can sound sparse, while too many can blur the sound.
The Haas effect (or precedence effect) describes how our auditory system integrates these early reflections, often perceiving them as a single fused sound event.
-
Room proportions: The dimensions of a room influence the formation of resonance modes (standing waves) and the distribution of reflections.
-
Materials: The materials used for the walls, floor, and ceiling determine the amount of sound absorbed or reflected. Absorbent materials reduce reverberation, diffusing materials scatter sound waves in multiple directions. A balanced acoustic design often uses a combination of absorption and well placed diffusion. Too much absorption can make a room sound “dead,” while too little can make it sound overly reverberant.
-
Directivity: The characteristics of the sound source, including its directivity, play a significant role in listener envelopment. This directivity must be adapted to the environment, ensuring it is constant, with coverage suited to the listening distance in order to maintain a balanced 50/50 ratio between the direct and reverberated fields taking account of our sensitivy. As we will see, with early reflections and diffusers, the horizontal axis becomes the most important in achieving this balance.
The critical distance
The critical distance refers to the distance from a sound source at which the level of direct sound equals the level of reverberated sound.
Beyond this point, reverberant sound dominates the sound field. The critical distance depends on both the characteristics of the sound source (such as its directivity) and the acoustics of the room.
While being at the critical distance influences the balance of direct and reflected sound, achieving a sense of good envelopment also requires careful management of early reflections and the distribution of sound throughout the space.
Lateral treatment, directivity and over-absorption
The treatment of lateral walls must always be considered in relation to the horizontal directivity of the loudspeaker. With wide horizontal radiation patterns, lateral walls are strongly excited and the first priority is often to control the amount of lateral energy reaching the listener, typically through significant absorption in order to limit early dominant reflections.
When the horizontal directivity is adapted to the listening distance (90° in a regular room), lateral excitation is naturally reduced. In typical domestic listening rooms, this places the listener close to the critical distance, or slightly beyond it, resulting in a more balanced relationship between direct sound and early reflected energy.
Under these conditions, rather than further reducing the quantity of lateral energy, the focus can shift to the quality of its redistribution. Because the lateral sound field is already sufficiently moderated, treatments can primarily aim at shaping the nature of reflections, minimizing specular components while preserving the lateral energy that contributes to listener envelopment and apparent source width.
This is where well-designed diffusers become particularly relevant. Quadratic or pseudo-random diffusers allow early lateral reflections to be redistributed over a wider angular and temporal range, reducing specular effects while maintaining the energy required for spatial perception.
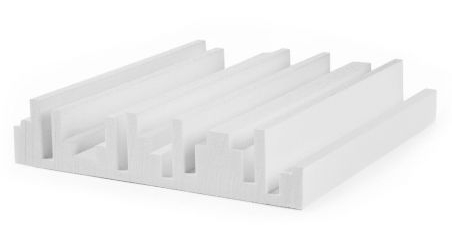
When lateral excitation is higher, the need to reduce excess energy tends to dominate the treatment strategy, leaving less freedom to optimize the spatial quality of lateral reflections. When directivity is adapted to the listening distance, diffusion becomes an effective tool to improve the perceptual quality of early lateral reflections without collapsing the horizontal soundstage.
In domestic rooms, where asymmetries such as windows or openings are common, this approach also proves more tolerant. A moderate asymmetry in reflection character, for example diffusive on one side and partially specular on the other, is generally less detrimental to envelopment than strong asymmetries created by excessive lateral absorption.
This is why lateral wall treatment strategies cannot be generalized and must always be evaluated in conjunction with loudspeaker directivity, listening distance and room geometry.
Optimization of the listener envelopment
To obtain an optimal listener envelopment, it is necessary to:
-
Control early reflections: By using absorbent or diffusing materials strategically, it is possible to reduce unwanted early reflections (e.g., those that arrive too quickly or from unfavorable angles). This might involve using absorption at specific points on the walls or ceiling to tame strong reflections, while using diffusers to scatter sound and create a more spacious feel.
-
Create a density of lateral reflections: A sufficient number of lateral reflections (reflections from the side walls) contributes significantly to a feeling of envelopment and better spatialization. These reflections should arrive slightly later than the direct sound and contribute to a sense of width and spaciousness.
-
Eliminate specular reflections: Specular reflections, which are like mirror-like reflections, create echoes and comb filtering, degrading intelligibility. It is important to diffuse or absorb them. Convex or 2D diffusers are often used to diffuse specular reflections.
-
Room proportions: The dimensions of the room influence the resonance modes and the distribution of reflections. In a corridor-type room, it will be very difficult to have a good envelope due to the lateral reflection and their management.
In some cases, it may be tempting to over-reduce the opening of the horns below what we recommend but this may create a gap in the envelope between low and high frequencies. This can result in a situation where the high frequencies are well-distributed, but the low frequencies are more focused, creating an uneven envelope and impacting the variation of intelligibility and frequency balance.
Early reflections are essential for creating a sense of envelopment in a room. These reflections contribute to the spatial perception of the sound, but their timing and pattern are crucial.
If reflections arrive too quickly or are too sparse, they can negatively impact the sense of space, leading to a feeling of emptiness or a lack of definition.
On the other hand, if there are too many reflections, they can blur the sound, reducing clarity and spatial precision.
The perception of envelopment is influenced by the interaction of these reflections with the direct sound, and the brain tends to integrate reflections that arrive shortly after the direct sound. The ideal balance of reflections helps create a rich and immersive experience without compromising clarity.
This explains why achieving a good listener envelopment is particularly challenging in small, narrow rooms, where reflections tend to occur too closely in time to create a sense of spaciousness. Modal issues are also more pronounced in smaller spaces, further complicating the creation of an optimal sound envelope.
Measurability
Several parameters can be measured to characterize the listener envelopment:
-
IACC (Inter-aural Cross-Correlation Coefficient): a measure used in acoustics to evaluate the similarity of sound signals that reach our two ears. Lower IACC values generally correlate with a wider, more enveloping sound, as the signals reaching the two ears are less similar.
-
Lateral Fraction (LF): a measure used in acoustics to quantify the proportion of sound energy that reaches a receiver after being reflected by the side walls of a room. Higher LF values suggest a greater contribution from lateral reflections, which are associated with a wider, more enveloping sound.
However LF is typically measured in concert halls, its application in small rooms is less common.
These measurements make it possible to characterize the envelope, but they generally require the intervention of a professional specialized in the field.
Conclusion
The listener envelopment plays a fundamental role in listening quality. By understanding the mechanisms that govern it and using the appropriate measurement tools, it is possible to optimize the acoustics of a space and create an immersive and realistic listening experience.
Source:
Objective measures of listener envelopment, 1995: https://nrc-publications.canada.ca/eng/view/accepted/?id=be12bb70-20ce-4d9e-ab16-99b48af4ef6c
LF:
http://www.winmls.com/2004/help/lflateralfraction.htm
http://www.winmls.com/2004/help/lglatelateralstrength.htm
http://www.winmls.com/2004/help/lfclateralfractioncosine.htm
IACC:
https://iaem.at/ambisonics/symposium2009/proceedings/ambisym09-avnirafaely-iaccspatcorrsh.pdf
Audibility
We are less sensitive to anomalies or even SPL drops above 10 kHz. This is due to the natural decline in our hearing sensitivity at high frequencies.
Here is our sensitivity according to frequency and SPL:
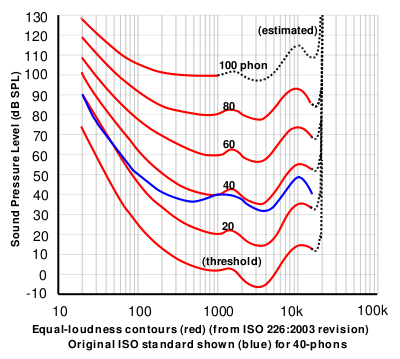
The bottom red line represents the sensitivity threshold of the human ear.
We must also consider that we live in a constant and measurable background noise. If a sound or a distortion (such as a high-order harmonic generated at high SPL) falls below this noise floor, it will be less audible—or completely masked.
Frequency Range and Information Density
From 10 to 20 kHz spans only one octave. This octave contains much less useful auditory information than lower bands. It’s rarely used by musical instruments or the human voice. In addition, our sensitivity in this region can be 10 to 20 dB lower than in the vocal range, making it very difficult to notice any issues—especially in the upper part of this octave.
The Masking Effect
The masking effect is a phenomenon where the presence of one sound (the masker) reduces the audibility of another sound (the masked).
This is particularly important when discussing low-frequency content and harmonic distortion.
Key Points
- Low-frequency masking: When a low-frequency sound is boosted, it can mask higher-frequency content. This can lead to a perceived loss of “kick” and a boomy or muddy sound.
- Frequency relationship: Masking is most pronounced when both sounds are close in frequency.
- Intensity: A louder masker will have a stronger masking effect.
- Distortion masking: This explains why high-order harmonic distortion (farther from the fundamental) is often more audible than low-order harmonics.
Here is how masking works from a fundamental tone:
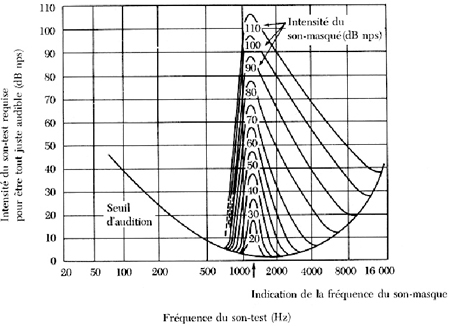
Pierre-Yohan Michaud combined these aspects, audibility and distortion, in his thesis “Distorsions des systèmes de reproduction musicale : Protocole de caractérisation perceptive” (Distortions in Music Reproduction Systems: A Protocol for Perceptual Characterization):
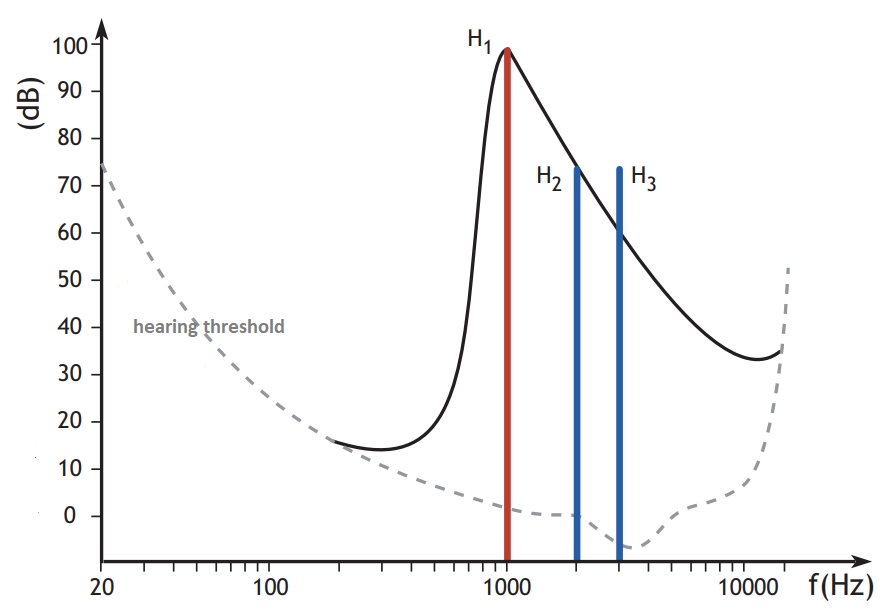
In this example, we can see that H3 is in the audible range, whereas H2 falls within the masking zone.
Practical Case: subwoofer masking the kick
A common real-world example of masking is when excessive low bass (e.g. below 70/80 Hz) rises too quickly. This will mask the upper bass — especially the “kick”/impact around 100–200 Hz.
To learn how to avoid this and integrate your subwoofer without degrading impact and clarity, see the Subwoofer and Masking Effect section.
Audibility of Compression Driver Breakup
The main difference between compression driver diaphragm materials lies in the breakup frequency and the associated temporal behavior, which can be more or less violent.
In practice, these effects wil be inaudible if or because:
-
It’s placed high enough: Above 8–10 kHz, human hearing sensitivity decreases exponentially compared to its midrange sensitivity. Depending on age and individual hearing, sensitivity in this region is typically between −15 dB and −40 dB relative to midrange. This alone makes high-frequency breakup much less perceptible.
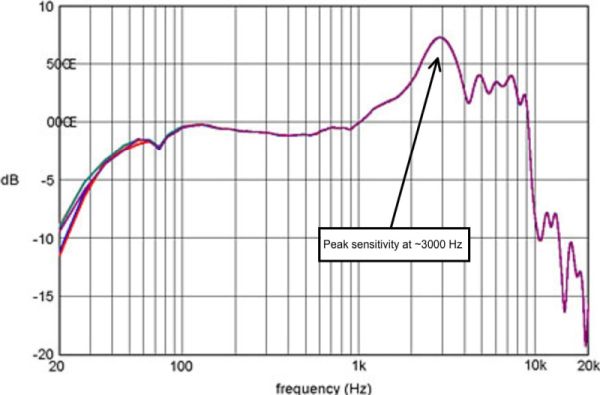
-
The temporal behavior is below human threshold: Breakup temporal issues are usually around −15 to −20 dB on a good diaphragm. Combined with the already reduced human sensitivity in this region, this can sum to roughly −30 to −35 dB, at the highest point, perceived by the auditory system, further reducing audibility.
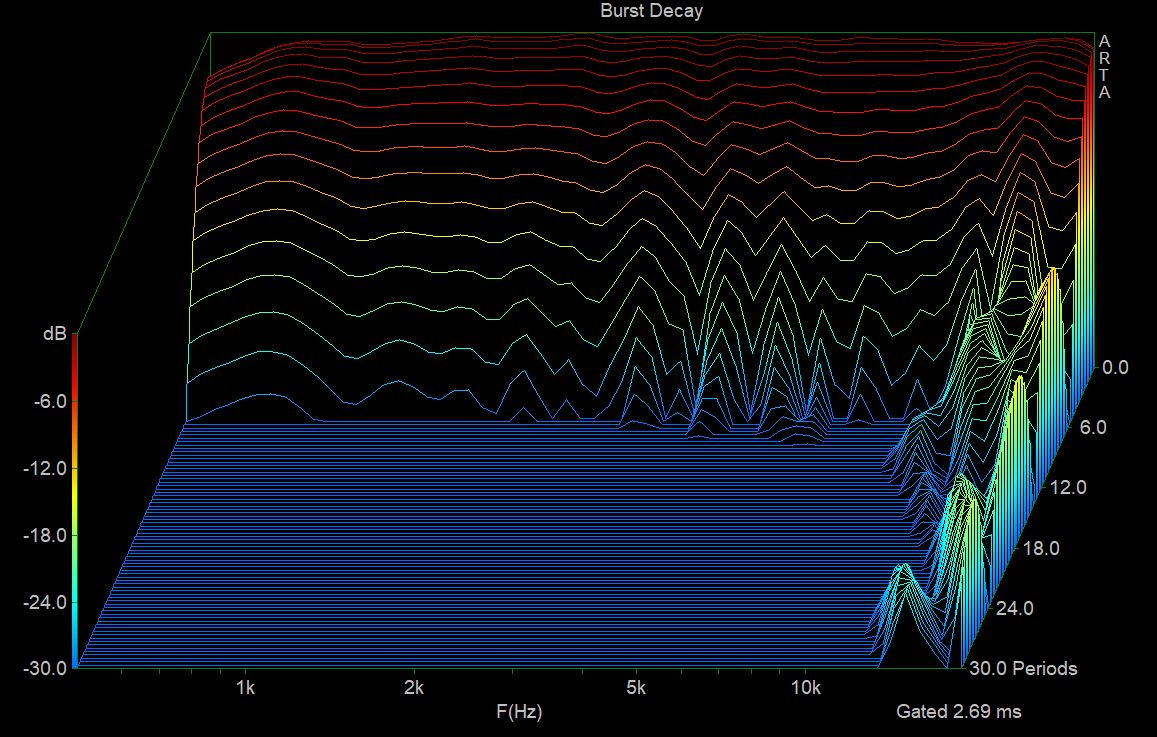
-
Limited musical information: The affected high-frequency range contains very little actual musical content. Even if there are temporal artifacts, they are unlikely to be noticed by listeners if placed high enough and at a low enough level in terms of dB.
⚠️ Warning
Do not try to “correct” ear sensitivity. The brain is naturally adapted to the ear’s frequency response curve. Attempting to artificially “flatten” this sensitivity can result in unbalanced sound and may even damage your ears (hearing loss, tinnitus) due to overexposure in the high-frequency region.
A speaker must be flat at 30–60 cm, as explained here: how to implement my horn and my speaker
sources:
- AES - The Masking Effect: https://www.aes.org/e-lib/browse.cfm?elib=200
- Wikipedia - Auditory masking: https://en.wikipedia.org/wiki/Auditory_masking
- Wikipedia - Equal loudness contour: https://en.wikipedia.org/wiki/Equal-loudness_contour
- Pierre-Yohan Michaud thesis : https://theses.hal.science/tel-00806288v1/document
- Frequency response of the human ear: https://www.compadre.org/nexusph/course/Frequency_response_of_the_human_ear
![]()
Unveiling a Speaker’s Sonic Behavior: Power Response and Directivity
Loudspeaker design is a delicate balance of factors.
Understanding a speaker’s directivity (how sound radiates in different directions) and its interaction with power response (the speaker’s ability to reproduce sound consistently across the frequency spectrum) is crucial in loudspeaker design, especially when considering listening distance.
While constant directivity waveguides offer distinct advantages, the interplay between a speaker’s coverage pattern (how sound energy is distributed) and the listening room’s acoustics plays a vital role in achieving a balanced sound.
A point about Critical Distance
In sound reproduction, understanding the critical distance is crucial, as it defines the ideal listening distance for achieving a balance between the direct sound from the speakers (direct field) and the reflected sound from the room (diffuse field).
A common target is a 50/50 ratio of direct to reverberated sound, although preferences can vary.
Our dedicated article about critical distance goes deep in this concept, where room acoustics (measured by Sabine absorption) and speaker directivity factor are the two main parameters.
The Challenge Beyond Critical Distance
As the listener moves further away from the speaker, two key challenges arise beyond the critical distance:
-
Inadapted Coverage to Listening Distance (Critical Distance): A loudspeaker with a coverage pattern that is inadapted to the listening distance (critical distance) will cause uneven sound reproduction, particularly in high frequencies. This can manifest in two ways:
-
Too Restricted Coverage: This leads to a perceived lack of detail and brightness (a muffled sound). This is because the sound reaching listeners lacks sufficient high-frequency energy due to the limited coverage pattern.
-
Too Wide Coverage: Conversely, a coverage pattern that is too wide relative to the critical distance can deliver an excessive amount of high-frequency energy to distant listeners. This can make the sound seem overly bright or aggressive, leading to listener fatigue.
-
-
Excessive High-Frequency Energy due to Room Acoustics: Even with a well-designed loudspeaker, the reverberant field in the listening room can sometimes add an excessive amount of high-frequency energy. Rooms with reflective surfaces like hard floors and bare walls can exacerbate this issue. This can contribute to a perceived harshness or fatiguing sound, particularly for listeners positioned further away from the speaker.
Power Response
This metric reflects the speaker’s ability to reproduce sound across the frequency spectrum with consistent loudness.
Imagine it as a frequency-dependent Sound Pressure Level (SPL) output. Ideally, a flat power response signifies the speaker outputs all frequencies at the same intensity, resulting in a balanced sound.
Deviations from a flat response, such as peaks or dips, indicate variations in loudness across different frequencies.
Power response is typically measured in an anechoic chamber (a specially designed room that absorbs sound reflections) and visualized as a frequency response curve. This curve plots the sound pressure level (SPL) output of the speaker in decibels (dB) across the frequency range (Hz).
There’s no single formula to generate this curve as it’s a result of the speaker’s physical design and materials.
Directivity Index (DI)
This measurement focuses on how the speaker radiates sound in different directions.
Unlike power response, DI doesn’t consider overall loudness, but rather how efficiently the speaker directs sound energy towards the intended listening area.
A high DI suggests the speaker is more directional, focusing its energy forward, while a low DI indicates a more omnidirectional sound pattern.
Then, a flat DI curve indicates a constant directivity behavior, meaning the speaker emits constant off-axis energy relative to on-axis.
DI calculation is demonstrated in Appendix section.
Optimizing Loudspeaker Design for Balanced Listening
The key lies in carefully considering both power response and directivity characteristics:
-
Coverage Pattern Design: A well-designed loudspeaker, regardless of whether it utilizes a constant directivity waveguide or another approach, should provide a constant coverage pattern that effectively disperses energy, particularly high frequencies but by respecting psyckoacoustics principles too, tailored to the intended listening distance, the critical distance. This helps maintain a balanced and detailed sound experience across the listening area.
-
Accounting for Reverberant Field: Understanding the impact of the listening room’s acoustics on the reverberant field is crucial. In some cases, acoustic treatments or room correction techniques may be necessary to mitigate excessive high-frequency buildup and ensure a natural listening experience.
Conclusion
By carefully considering power response, directivity characteristics, and the influence of the listening room, loudspeaker designers can create speakers that deliver a natural and detailed listening experience across a wider range of distances.
This comprehensive approach is essential for achieving a balanced sound, regardless of the specific loudspeaker design.
Appendix: DI Formula
The formula for DI using the spherical integral is:
DI(θ) = 10 log ( (∫ P(θ, φ) dΩ ) / P(0, 0)^2 )
- DI(θ): Directivity Index at angle θ (degrees)
- P(θ, φ): Off-axis Sound Pressure Level at a specific angle (θ, φ) in spherical coordinates (θ for horizontal angle, φ for vertical angle)
- dΩ: Differential solid angle element (used in the integration process)
- P(0, 0): On-axis Sound Pressure Level (dB)
- ∫: Integral symbol representing summation over the entire sphere’s surface area
Understanding and calculating dΩ:
The differential solid angle element (dΩ) represents an infinitesimally small piece of the sphere’s surface area. It’s crucial because the integral in the DI formula sums the off-axis sound pressure levels (P(θ, φ)) across the entire sphere. However, areas closer to the poles have a smaller surface area compared to those near the equator. dΩ accounts for this variation:
Formula for dΩ in Spherical Coordinates:
dΩ = sin(φ) dθ dφ
- φ (phi): Vertical angle (ranging from 0° to 180°)
- θ (theta): Horizontal angle (ranging from 0° to 360°)
Explanation of dΩ Formula:
-
sin(φ): This term ensures that off-axis sound pressure levels near the poles (where φ approaches 90°) are weighted less due to the smaller surface area in those regions. As φ increases towards the poles, the sine of φ gets smaller, effectively reducing the weight given to those SPL measurements.
-
dθ and dφ: These represent infinitesimal changes in the horizontal and vertical angles, respectively. Multiplying them by sin(φ) calculates the area of a tiny rectangle formed by these infinitesimal changes on the sphere’s surface.
Integration and DI Calculation:
- For each off-axis measurement point defined by specific θ and φ values, we:
- Calculate the corresponding dΩ using the formula above.
- Multiply the measured sound pressure level (P(θ, φ)) by this dΩ. This weights the SPL measurement based on the area it represents.
- The integral (∫) symbol then sums these weighted sound pressure levels (P(θ, φ) * dΩ) across the entire sphere.
By incorporating dΩ, the integration process considers the varying sizes of surface area elements. This ensures an accurate calculation of the total sound power radiated by the speaker, which is then compared to the on-axis SPL to determine the directivity index (DI) for different off-axis angles.
![]()
The Physics of Perception:
Sound travels as waves, characterized by properties like frequency (pitch) and amplitude (loudness). Psychoacoustics delves deeper, examining how our ears and brains interpret these physical properties to create the auditory experience we know.
Key Concepts in Psychoacoustics:
-
Loudness Perception: Our ears don’t perceive loudness linearly. A sound that’s twice the intensity of another won’t necessarily sound twice as loud. Psychoacoustics helps explain this phenomenon, known as the Fletcher-Munson curves, which depict how human hearing perceives loudness at different frequencies.
-
Masking: Psychoacoustics explores how different frequencies interact and how masking affects our ability to distinguish sounds and why some are masked, see the full article here: The Masking Effect.
-
Localization: We can identify the direction of a sound source with remarkable accuracy. Psychoacoustics examines how our brain uses minute timing and intensity differences between our ears to localize sound.
-
Timbre: This quality allows us to distinguish between different instruments playing the same note. Psychoacoustics helps us understand how the complex interaction of overtones and harmonics within a sound wave contributes to timbre perception.
Applications of Psychoacoustics:
The principles of psychoacoustics have numerous practical applications:
-
Audio Engineering: Sound engineers leverage psychoacoustics to optimize sound recordings and playback systems. They can manipulate elements like compression and equalization to create a more pleasing listening experience.
-
Hearing Aids: By understanding how hearing loss affects sound perception, psychoacoustics helps in designing hearing aids that compensate for these deficiencies and improve speech intelligibility.
-
Noise Reduction: Psychoacoustic principles are used to create effective noise-cancelling headphones and active noise control systems, which reduce unwanted sounds by generating cancelling sound waves.
Practicals Studies
Dr. Floyd E. Toole’s studies indicate that listeners tend to prefer a decay in the high frequencies and a smooth change in directivity index (DI), even though the DI should increase in very high frequencies (making the speaker more directive near 7/8 kHz).
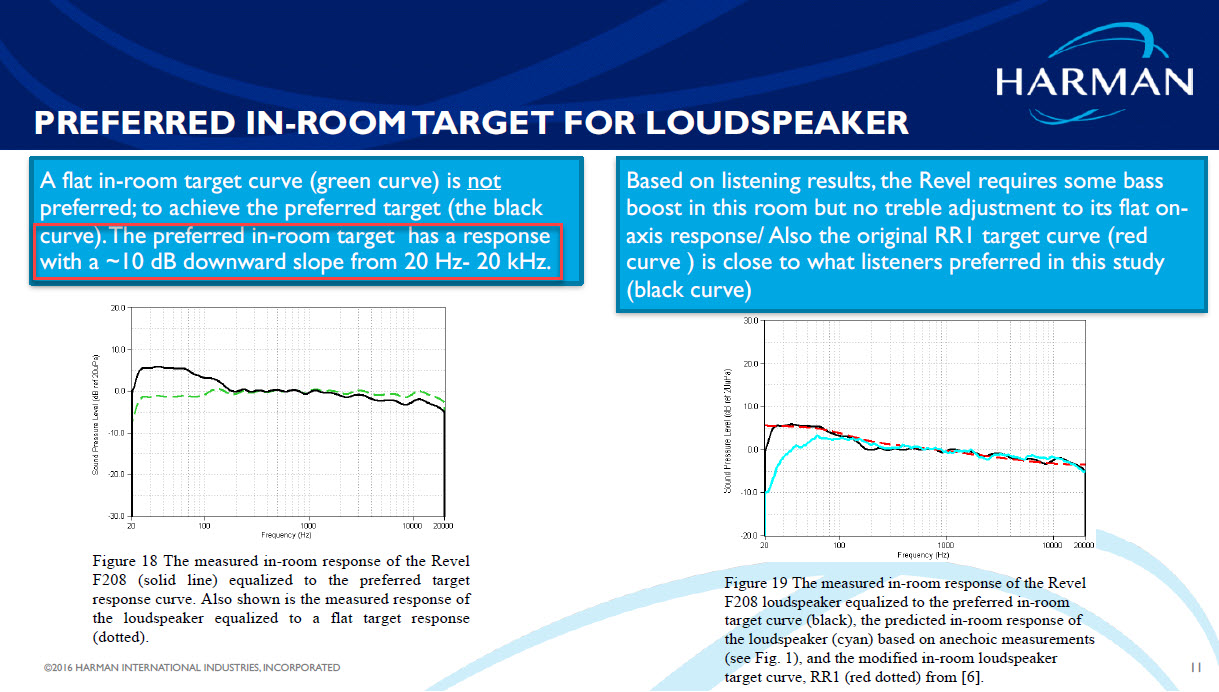
To mitigate the conclusion about the significant decay in frequency response, it should be noted that the Revel speaker’s 120° radiation pattern used here is often too wide for many listening spaces and typical listening distances.
This wide dispersion contributes to the desired attenuation, but more tailored coverage and better energy balance will reduce the severity of the frequency response decay.
Below this very high frequency decay, the radiation must be constant and controlled as lower as possible, without major accidents or diffraction.
In the horizontal polar response relative to 0°, this appears as follows, with no abrupt transitions when directivity control is lost at high frequencies:
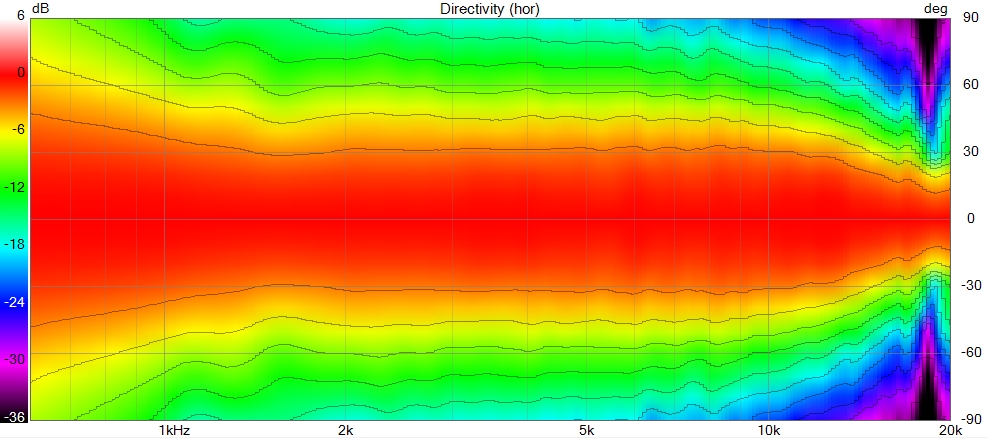
Horn selection is based on coverage adapted to listening distance and room acoustics, while the woofer’s direct radiation pattern remains inherently fixed.
Consequently, their directivity characteristics differ at certain frequencies.
To avoid abrupt directivity transitions, the crossover frequency is positioned where both the horn and woofer exhibit similar radiation patterns: where the horn’s controlled coverage narrows and the woofer’s natural beaming begins, becoming more directional.
This ensures a smooth transition between the two drivers, as explained in the Directivity Match article.
The primary goal is to adapt coverage to listening distance and acoustics without causing an abrupt change in the Directivity Index.
Conclusion:
Psychoacoustics plays a crucial role in shaping our auditory world, but a one-size-fits-all ideal target curve does not exist, as it depends of your acoustics, listening distance and speaker directivity so each “curve” is unique as seen in last point in how to implement my horn and my speaker, do not try to match a generic target curve at listening position.
By understanding the intricate relationship between sound waves and human perception, we can not only appreciate the science behind hearing, but also leverage this knowledge to improve sound design, enhance listening experiences.
![]()
Introduction
Loudspeakers, despite their crucial role in sound reproduction, can introduce unwanted distortion.
One significant contributor is cone breakup, a phenomenon related to the moving material (diaphragm, cone…) resonance at high frequencies.
This article dives deeper into the science behind cone break-up, its impact on sound quality, and explores filtering techniques to mitigate this issue, focusing on woofer breakup, for compression drivers we recommend reading our masking effect and audibility article.
What is speaker break-up?
1. Basic operation
When a speaker emits sound, the voice coil, driven by the signal from the amplifier, moves. Since it is attached to the membrane (cone driver) or a diaphragm (compression driver), it pulls the radiating surface along in its movement.
There are three stages of membrane behavior as frequency increases: pistonic motion, non-pistonic motion, and breakup modes — the latter being a more severe form of non-pistonic behavior characterized by modal resonance patterns across the membrane materials.
At low frequencies, the membrane or cone driver moves uniformly in a pistonic motion.
2. Transition from pistonic to non-pistonic motion
As frequency rises, the radiating surface size becomes comparable to the wavelength, causing phase differences across the surface that lead to a progressive narrowing of directivity.
This geometric effect alone occurs even if the membrane behaves like a perfectly rigid piston.
Simultaneously, material properties induce internal wave propagation delays and localized resonances,
which affect the membrane’s motion and sound distortion but have a secondary influence on directivity compared to the geometric factor.
These phase shifts between the membrane center (driven by the voice coil) and its edges cause the motion to deviate from pure pistonic behavior,
marking the onset of non-pistonic motion. However, this stage does not yet involve breakup or fractionation.
3. Breakup modes and material implications
Breakup modes (or fractionation) arise at higher frequencies, when parts of the radiating surface resonate independently, forming complex modal patterns that depend on the material properties of the membrane.
This results in distortion and irregular radiation distinct from the earlier smooth non-pistonic behavior.
To delay the onset of fractionation, manufacturers can opt for more rigid membranes. However, an ultra-rigid membrane is not ideal, as it introduces internal vibrational modes, also known as modal resonances.
At certain frequencies, these modes cause localized resonances across the surface of the membrane, where different parts vibrate inconsistently, generating undesirable distortions.
Fractionation is inevitable because it is inherent to the shape and material of the membrane.
However, a more rigid membrane will fractionate at higher frequencies and with greater intensity, while also generating more internal vibrational modes, which can contribute to additional distortion.
4. Material strategies and special cases
This is why cone speaker designers often use composite materials and blends to construct membranes, the goal is to strike a balance between rigidity, damping, and weight.
Rigidity pushes fractionation to higher frequencies, while damping reduces the energy of internal resonances, thereby limiting distortion and resonance peaks caused by vibrational modes.
For compression drivers, the diaphragm is usually smaller, and its breakup typically occurs outside the ear’s sensitive range, so it’s less of a problem.
Causes of Cone Break-Up
Cone break-up occurs when the loudspeaker cone resonates at high frequencies, causing it to vibrate in unwanted ways beyond its intended pistonic motion. Several factors influence this resonance:
-
Dimensions, Thickness, and Shape of the Cone:
The size, thickness, and curvature of the cone significantly impact its resonant behavior. Thinner or flatter cones tend to break up earlier than rigid or curved ones. -
Cone Material:
Different materials possess varying stiffness and damping properties. Stiffer materials like metals are more prone to break-up, while materials with inherent damping, like treated paper or composites, can help reduce it. -
Boundary Conditions of the Cone:
How the cone is secured to the frame (suspension) also plays a role. A flexible suspension allows for a wider range of motion before break-up occurs, while a stiffer suspension might limit total excursion but could lead to earlier break-up at specific frequencies.
Impact of Cone Break-Up on Distortion
When the cone breaks up, it generates standing waves that distort the original audio signal.
These distortions manifest as harmonic distortion, perceived as a coloration or harshness in the sound, a H3 distortion at 1khz, so create by a 1khz signal alone, will create sound at 3khz (3 times fundamental).
When a violent break-up occurs at 1500Hz, we have a H3 rise-up at 500Hz (1500/3), so even if we cut at 1kHz we will have the distortion associated to the break-up in the signal and when we will play 500hz we will have an unwanted signal at 1500Hz.
Breakup will also bring Time-domain problems and – for compression drivers – out of plane wave radiation behavior, expecially visible with compression drivers in horns.
Cone Break-Up and Electrical Current
The speaker cone is a mechanical system. When it encounters its resonant frequency, it tends to vibrate in uncontrolled ways – this is cone break-up.
This uncontrolled motion is related to the electrical current flowing through the voice coil.
As the cone vibrates, it generates a back electromotive force (EMF) that opposes the current flow and creates current distortion in the voice coil.
Inductance and Impedance
An inductor opposes changes in current flow. When you increase the inductance in the circuit (like the inherent self-inductance of the voice coil or by adding an external inductor), the overall impedance of the circuit also increases.
Impedance acts like electrical resistance for AC signals like audio.
How Increased Inductance Helps
Here’s how increased inductance tackles cone break-up:
-
Limits Current Flow at Resonance: At the cone’s resonant frequency, the back EMF from the uncontrolled vibration is strongest. The increased inductance makes it harder for the current to rise significantly at this frequency. This reduces the electrical energy delivered to the voice coil, thereby lessening the uncontrolled movement of the cone.
-
Partial Damping Effect: Though not a traditional damping mechanism, the increased opposition to current changes caused by the inductance can have a damping effect. This helps to suppress the excessive vibration of the cone at resonance.
However, it’s important to consider these points:
-
Limited Effect: Increased inductance alone might not entirely eliminate cone break-up, especially for severe break-up issues. It’s often a contributing factor in conjunction with other design elements like cone material and suspension.
-
Frequency Dependence: The impedance increase due to inductance is most significant at higher frequencies. So, the effectiveness in mitigating break-up depends on the resonant frequency of the cone relative to the desired operating range of the woofer.
Filtering Techniques for Break-Up Reduction
Several filtering techniques can be employed to address cone break-up and reduce associated distortion.
As it’s based on impedance rise-up, an EQ in DSP will not have an impact.
The result depends on the woofer’s motor, but it mainly impacts the H3 in most cases. It depends on the design of the motor, the voice coil, and the inductance value. The lower and more linear it is, the less current distortion and distortion in the midrange occur (i.e., a plateau distortion not linked to excursion), which explains why a notch filter has no effect on the distortion of compression drivers, tweeters, and other speakers such as 18Sound AIC speakers.
It’s important to note that these filtering techniques are most effective when the break-up rise up in frequency (one or more big peaks) and/or when woofer is rising up in his final box. If the breakup is already damped, so more or less flat and the woofer has already a flat response in box, it will useless to try something about it.
Each with its advantages and limitations:
Notch Filters
These passive filters use a combination of inductors (L) and capacitors (C) to create a high impedance at the resonant frequency. This effectively reduces the current flow at that frequency, minimizing cone excitation.
However, precise tuning is crucial, and if certain components are placed in parallel with the circuit, this will bypass the impedance effect and make the notch effect on breakup distortion ineffective. So it will work well in conjunction with active filtering, less in passive filtering.
Here is the H3 of a Dayton RS52 with and without LC notch :
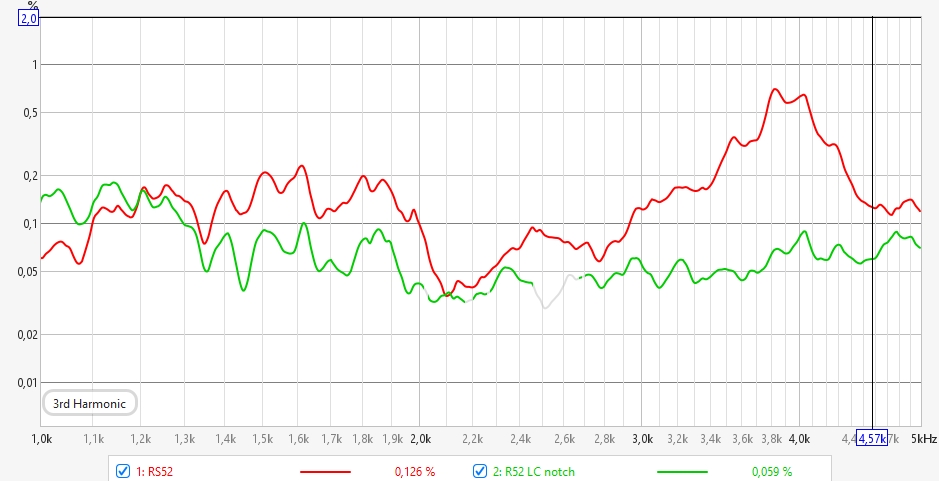
Air core inductors with active filtering
These first-order filters, in series, often implemented with a single inductor, allow lower frequencies to pass through while attenuating higher frequencies, including those near the break-up point. This approach offers a simpler design and also linearize the woofer, it’s the easier solution.
It will increase gradually the impedance and replace some EQ to linearize the woofer in the same time, it works very well if the woofer is already rising up in his final box.
The inductor must be an air core inductor and not an iron core inductor; otherwise, it will add H3 distortion in the low end.
Here is the H3 of a SbAcoustics WO24P with and without air inductor in serie :
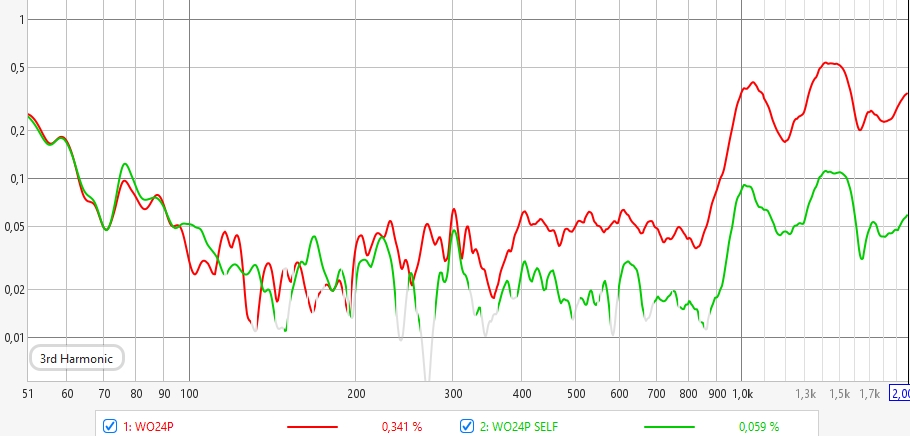
Compensation Networks
More complex networks can be designed to address specific break-up modes. These may involve additional components and require detailed analysis of the cone’s behavior.
Self Inductance
While not a filter in the traditional sense, the inherent self-inductance of the voice coil can also contribute to a rise in impedance at higher frequencies.
This can have a similar effect to filtering, potentially mitigating break-up to some extent.
However, it’s often a secondary effect and may not be sufficient for significant break-up control.
Conclusion
Cone break-up is a significant factor in loudspeaker distortion, impacting sound quality.
By understanding its causes and employing targeted filtering techniques like notch filters or high-pass filters, speaker designers can achieve smoother, more accurate sound reproduction.
![]()
Introduction
When it comes to crafting the perfect speaker, meticulous attention is paid to every detail, from the materials used to the precise arrangement of the drivers.
One crucial factor, often overlooked, is the center-to-center distance between the mid-woofers and the tweeter section.
Placing them too close together can create a phenomenon known as vertical lobing, negatively impacting sound quality.
Understanding Vertical Lobing
Vertical lobing reduces overall coherence. When two woofers interact and create off-axis cancellations, the soundstage can lose its unity, especially around the crossover region. This may give the impression that the low and high frequencies are not blending seamlessly, resulting in a less stable and less powerful presentation.
At typical listening distances, where direct and reflected sound are balanced, these vertical cancellations become more apparent in the perceived image. They create regions of weaker output above and below the acoustic axis, contributing to a soundscape that can feel fragmented if the driver spacing is not well controlled.
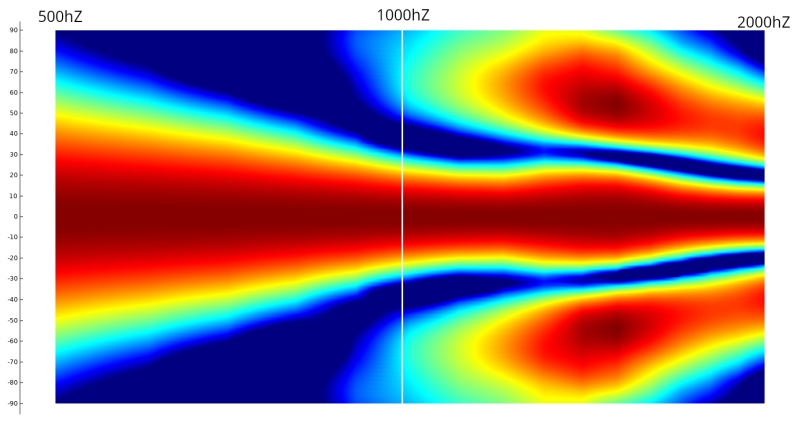
While an ideal center-to-center spacing close to 66 percent of the crossover wavelength minimizes these effects, perfect compliance isn’t always required. Our hearing is also less sensitive to vertical irregularities because the ears sit horizontally and the brain naturally compensates for floor reflections.
Is it perceptible?
While the ideal center-to-center distance is roughly 66% of the crossover wavelength, achieving perfection is not always necessary for several reasons:
Our ears are more sensitive to horizontal reflections than vertical ones due to their orientation and the brain’s adaptation to floor reflections.
The perception of a “point source” comes from the coherent summation of sound waves between the drivers. This behavior depends strongly on the center-to-center spacing relative to the wavelength at the crossover frequency, but not only.
Listening distance also plays a major role. A system heard at 1 meter behaves differently than at 6 or 30 meters. At sufficient distances, even a large line array is perceived as a point source.
Any well-designed loudspeaker with a sufficiently low crossover frequency, especially horn-loaded systems, will exhibit point-source behavior at a reasonable distance, even large systems. In practice, when listening from more than 50–70 cm, achieving the sensation of a point source does not require special measures compared to a conventional two-way system where the drivers are crossed low enough and positioned close enough to each other.
The issue of lobing is not determined by center-to-center distance alone. This spacing must be considered together with the crossover frequency (therefore the wavelength) and the listening distance; taken in isolation, center-to-center spacing is meaningless.
The Diffraction Impact
When using a low crossover with closely spaced components, lobing issues are largely mitigated. However, diffraction can still be present, especially in small loudspeakers, degrading the vertical polar response and, in extreme cases, affecting the horizontal response when elements are very close together.
The physical presence of the woofer inherently causes diffraction and affects directivity.
Many people mistakenly attribute vertical polar degradation to lobing, when in fact it is the high-frequency wavefront being diffracted by the physical presence of the woofer positioned below that causes most of these artifacts, simply because it is seen as a physical obstacle by the high-frequency wavefront arriving on it.
This effect is more pronounced in smaller loudspeakers. In smaller loudspeakers, the drivers are closer together, so the wavelengths produced by the high-frequency section and affected by this diffraction are shorter. Unfortunately, these shorter wavelengths are more prone to beaming (leaving the surface) and creating these artifacts.
This aspect also applies to coaxial or MEH. It can even be worse, as the obstacle – for example, the coaxial surround – is completely symmetrical around the center of emission. This concentrates the problem and makes it even more pronounced if the surround and/or any other possible obstacles are not smoothed. These concentrated artifacts further affect a directivity that is already less uniform and clean than that of a well-implemented constant directivity horn.
The polar responses of these systems can be seen in the MEH and coax sections of our MTM, 2.5 or 3 voices article.
This behavior is detailed in our article dedicated to diffraction, particularly in the “Diffraction on Woofer” section.
MTM Configuration: A Balancing Act
The MTM (Mid-Tweeter-Mid) configuration, where the tweeter sits between two mid-woofers, also faces similar challenges.
With a single woofer, the vertical radiation pattern remains consistent if proper implemented. When a second woofer is added in close proximity, certain frequencies will overlap and partially cancel, most noticeably above and below the acoustic axis. These vertical cancellations form lobes – areas of reduced output – which can make the system sound less cohesive, as if the woofers and tweeter were not fully integrating.
To address these effects, one would need to cross the woofers extremely low or place them almost touching, which is impossible in an MTM arrangement. The elegant solution is a 2.5-way filtering in an MTM configuration. We cover this in the dedicated article: MTM, 2.5 or 3 voices ?.
Horizontal Lobing
Placing woofers horizontally introduces also horizontal lobing.
This create similar cancellation effects, which in some cases can be used to shape the directivity to match a horn. However, lobes are very sensitive, so the woofers must be extremely close together and not too large. Simulations should always be used.
We also address this point in our MTM, 2.5 or 3 voices article.
Perfect Vertical Alignment
Vertical alignment between the high-frequency section (tweeter) and the mid-woofer section, on the same vertical line, is crucial.
Misalignment can cause phase cancellation at different angles on the left and right sides of the speaker, leading to reduced power response and create sound inconsistencies.
The Takeaway and How to Fix It?
Careful consideration of both center-to-center distance and vertical alignment is essential for achieving optimal sound quality. By maintaining a suitable separation and precise alignment, speaker designers can minimize lobing and ensure a smooth, coherent listening experience.
Remember, minimizing lobing involves a delicate balance. While lobing caused by excessive spacing is generally easier to address compared to other acoustic challenges, achieving optimal sound quality requires careful consideration of both center-to-center distance and other design factors. Placing drivers closer together is the solution, but a lower crossover frequency might also be needed.
Here are some techniques speaker designers use to address lobing:
-
Maintaining a suitable center-to-center distance: This distance is roughly 66% of the crossover wavelength for optimal performance, but slight deviations can be acceptable depending on the overall design.
-
Lower crossover frequencies (a design consideration): A lower crossover frequency help to mitigate lobing in some designs, it affects the overall response (we have to take care about distortion and directivity match at crossover) and is a factor weighed during the design process.
Time alignment is another important tool in a speaker designer’s arsenal. By electronically adjusting the timing of signals sent to each driver, they can achieve better phase coherence and reduce lobing effects. However, it’s a separate consideration from the physical placement of drivers.
By understanding these techniques and the trade-offs involved, speaker designers can create speakers that deliver a rich and well-balanced listening experience.
![]()
When it comes to horns, the energy distribution across frequencies is a crucial factor as a horn is an energy distribution device.
This article explores how the driver itself and the horn interact to shape this energy distribution.
The overall balance and brain
Adapting Directivity to the Listening Distance
We listen at a so-called critical distance where the direct field (sound coming directly from the speaker) and the reverberant field (sound reflected from the walls) are in a 50/50 or 60/40 balance. The reverberant field is composed of off-axis radiation that returns to the listening position even when we are directly in front of the speaker, due to wall reflections. These reflections are effectively merged with the initial direct field.

This balance means we must adapt the coverage angle to the listening distance, rather than follow a “one opening fits all” 120° approach typically used in control rooms or recording studios.
These professional sound environments are extremely damped, intentionally prioritizing control over soundstage. In a living room, however, the goal is to create a wide and natural soundstage in a less damped, more lively acoustic space.
A coverage of about 90° horizontally and ~60° vertically better matches these conditions, taking into consideration listening distance, room acoustics, and even room shape, thanks to the narrower vertical dispersion compared to the horizontal one. For a tweeter waveguide, achieving such coverage, which is narrower than the tweeter’s natural radiation over most of its bandwidth, requires a more advanced solution.
Energy Balance and Perceptual Effects
In practice, when we perceive a sound as aggressive at high volumes, an imbalance between treble and the rest of the spectrum as we move further from the speaker, or a lack of impact, it is likely due to two factors:
- An imbalance between the direct field, aka on-axis sound, and the reverberant field, aka off-axis radiation that returns due to wall reflections
- An imbalance in the energy radiated and perceived by the ears across the full frequency spectrum of the speaker
If the coverage of our speaker is too wide in the upper half of the spectrum, where directivity control is most perceptible, we end up with too much reverberant energy compared to the direct field, and globally too much energy in the upper range of the speaker relative to the lower range.
Our ears are particularly sensitive to the upper midrange and treble frequencies, where sound is more likely to damage the hearing system. Excessive energy in these regions can lead to fatigue, discomfort, and even long-term hearing damage. More details in our audibility article.
To prevent this, our brain instinctively limits the volume when the sound becomes too intense in this area — it’s an internal psychoacoustic SPL limiter.
Too much radiated energy in the upper range reduces our ability to increase the overall level comfortably.
Balancing the energy between the midrange, low midrange, and high frequencies helps mitigate this issue and allows for higher usable SPL.
This ability to listen at higher SPL, thanks to a better balance between reverberant and direct fields — and between each part of the frequency spectrum — is what creates the sense of impact or kick.
It explains why “kick” is easy to achieve outdoors but harder to reproduce in small or medium-sized rooms. This is why using the right constant-directivity coverage for our horn is essential, instead of following the 120° trend.
A well-balanced energy distribution allows our brain to “authorize” higher volumes without triggering the pain or fatigue response.
In contrast, direct-radiating loudspeakers or 120° designs, which typically disperse sound over a wider area, create uneven sound fields that are more prone to causing fatigue due to over-radiated energy in the upper range, depending on listening distance and acoustics. This limits maximum SPL, reduces the sensation of kick, and results in a less balanced sound.
Final Thoughts
By using a loudspeaker with constant directivity and optimizing our room acoustics, you can enjoy a more balanced and immersive listening experience, even at higher volumes, with greater impact in the low end of the spectrum.
This approach is not new — it’s how professional acousticians design Home Theaters or personal listening setups, aiming for a comfortable listening experience, a wide soundstage, and strong impact in the low end.
To truly take our sound reproduction to the next level, it’s essential to use solutions adapted to the specific situation at hand, rather than simply applying approaches developed for a completely different environment and purpose.
The Driver’s Role
The energy a compression driver produces is determined by several factors:
-
Diaphragm Size: Larger diaphragms naturally produce more low-frequency energy, but their breakup can impact very high frequencies .
-
Motor Characteristics: The motor’s sensitivity and resonance frequency (Fs) as other characteristics influence the overall energy output and roll-off at low frequencies.
The Horn’s Influence
The horn plays a significant role in how energy is distributed:
- Loading:
Horns act as a load on the driver, affecting its response at different frequencies. This loading effect is most prominent at lower frequencies and diminishes significantly as we move up the frequency range.
More details here: acoustic loading
- Horizontal and vertical directivity:
The horn’s directivity pattern, both vertical and horizontal, significantly influences on-axis energy. Decreasing horizontal coverage helps retain more energy on-axis.
Reducing vertical coverage redirects some off-axis energy back toward the on-axis region. However, it’s important to note that reducing vertical directivity improves sensitivity only within the bandwidth where vertical and horizontal coverage overlap.
As the horn’s mouth height decreases, vertical control is lost earlierb than horizontal one. When vertical control is lost but the horn is still in use, the overall loading is affected because a portion of the energy escapes vertically uncontrolled in the low end.
The throat defines the end of directivity control, a parameter to consider with large AMT drivers, where a tall vertical throat limits the vertical control of the waveguide.
Ultimately, when both horizontal and vertical control are lost, depending on the horn mouth size, the horn cannot benefit from loading, setting an absolute limit on the potential loading effect.
- Constant Directivity:
Horns designed for constant directivity, which maintain a consistent sound dispersion across a specified angle, redirect part of the energy off-axis. This means that energy redirected off-axis is no longer present on-axis.
This can be seen with the high frequency roll off of a compression driver horn, where this behavior helps preserve the intended directivity pattern.
With a tweeter mounted in a waveguide, since the natural tweeter radiation is wider than a typical 90° waveguide, more energy is directed on axis as the frequency decreases when a 90° waveguide is used. When the wavelength becomes smaller than the waveguide, the tweeter’s own radiation pattern dominates and produces a natural directivity slightly below 80°.
For a good listening experience, psychoacoustic studies provide a general guideline: constant directivity should be maintained up to approximately 7–8 kHz minimum, then can gradually decrease above this range.
More details in our Constant directivity article.
The interplay between driver characteristics, horn loading and horn directivity creates a phenomenon known as the “bell response” that is explained in Horn Response article.
High Frequencies and Physics
Physics dictates that horn loading has minimal impact on very high frequencies, as it’s related to acoustic loading.
In this region, the driver’s motor characteristics become the primary determinant of energy output as, on best horn about loading, loading is inversely proportional to frequency and ends when horn’ control ends.
The effect of acoustic loading (aka the “loading effect”) is inversely proportional to the frequency.
Horn Low-End Roll-Off
The driver’s motor naturally starts to produce less energy at lower frequencies, depending on its characteristics and diaphragm size.
This reduction in motor output, combined with the decreasing horn loading effect at low frequencies, contributes to the natural roll-off in low-end response. As the horn’s width becomes insufficient to maintain the wavefront, the directivity pattern widens significantly, marking the limit of the horn’s effective loading capability and resulting in a drop in sound pressure level.
At this point, the reactive load can no longer be effectively positioned within the horn’s directivity control band, and any attempt to increase loading will have little to no effect.
Horns with stronger reactive loading prior to this limit typically exhibit a sharper fall, which simultaneously produces an appreciable “free” SPL gain just above the cutoff, making them more effective in the low-frequency extension.
Below this point, any adjustment of the reactive load becomes ineffective, as both the motor limitations and the loss of directivity control combine to define the horn’s low-frequency boundary.
Don’t Waste Energy: Directivity and Efficiency
Adapting the horn’s directivity pattern according to the listening distance is not just about improving the listening experience.
It also allows us to respect the critical distance, the point where the direct sound from the driver and the reflected sound in the room reach a balance (around 50/50 or 60/40).
By maintaining constant energy directionality up to 7–8 kHz minimum with coverage adapted to the critical distance, we ensure efficiency while achieving clear and accurate sound reproduction.
This approach preserves the balance between direct and reflected sound within the critical distance.
This is where the concept of “midrange narrowing and beaming” comes into play. This phenomenon, although primarily affecting off-axis response, can also slightly impact the on-axis response, representing a loss of usable energy and contributing to an imbalance in sound reproduction.
More details can be found in the linked article: Midrange narrowing and beaming
A Note on Frequency Correction (EQ) and Phase Shift
As described here: How to implement my horn and my speaker, the proper way to correct the frequency response is using IIR (minimum-phase) EQ:
-
Minimum-phase filtering also affects phase, which is a positive feature. Wherever there is a peak or dip in frequency, the phase is impacted in the same way. An IIR EQ will therefore correct both the amplitude and phase responses simultaneously, in a beneficial manner. This phase response adjustment is necessary to help linearize the overall response.
-
FIR filtering (linear-phase filtering) should be used only for crossovers. When implementing a crossover, we aim to divide the frequency spectrum without affecting phase, which is exactly what FIR filtering provides. FIR should not be used for EQ, only for crossover.
Conclusion
The study of horns demonstrates that energy distribution is the key to both efficiency and perceptual quality. The interaction between driver characteristics, horn loading, and directivity determines how energy is radiated across frequencies and angles, directly influencing the on-axis and off-axis balance, and ultimately our listening experience.
Adapting the horn’s coverage to the critical distance ensures a proper balance between direct and reflected sound, allowing the brain to perceive higher volumes comfortably, maintain impact, sound stage, fidelity, and reduce fatigue.
Horns with better-managed directivity and loading allow higher SPL in the low and mid frequencies, while preserving energy balance.
Ultimately, achieving a balanced, immersive, and impactful sound requires selecting solutions that are adapted to the specific listening environment and purpose, rather than copying approaches developed for different acoustic conditions. Energy management, directivity, and psychoacoustic considerations are the foundation of a truly optimized horn system.
![]()
Sound Source Behavior: Near Field, Transition, and Far Field
Understanding how sound waves behave near their source is crucial in various audio applications.
Here, we’ll explore the characteristics of sound in three key regions, including how sound pressure level (SPL) changes with distance.
Near Field & Fresnel Zone
Near field and Fresnel Zone is not exactly the same concept:
-
Fresnel Zone: This zone focuses on wavefront curvature. It defines an area where the curvature of the wavefront is important for accurate calculations of sound propagation.
-
Near Field: This zone focuses on sound pressure variations. It’s the region where sound waves haven’t fully developed their characteristic shape.
The near field, is the region close to the sound source where sound waves are flat or haven’t fully formed (chaotic), depending on source drivers and frequency.
In a single source they both end at the same place, at the transition distance, but not in the case of a composed source (Line Array, SBA).
Sources:
- “Sound System Engineering” by Carolyn Audio Engineering
- “Audio Engineering Handbook” by Gary Davis and Ralph Jones
The behavior of different sound sources in the near field can vary
-
Cone and Dome Drivers: Due to their operating principle and emissive shape, cone and dome driver wavefronts in the near field are complex and exhibit pressure variations. This complexity arises because the sound wave hasn’t propagated enough to establish a stable wavefront structure and diffractions occurs whith surround. As a result, the sound pressure can vary significantly depending on the frequency of the sound wave.
-
Compression Drivers: Compression drivers exhibit a more plane wave-like behavior in the near field, especially at lower frequencies. However, it’s important to note that this “flatness” is relative and depends on the specific distance and frequency. Even in the near field, the wavefront can exhibit some curvature or phase variations, especially at the edges. As the sound wave propagates through the horn throat, it starts to interact with the horn’s geometry, further influencing the wavefront shape.
-
Line Arrays (composed source): Line arrays, with their elongated design, can present a relatively flat wavefront becoming cylindrical-like with the distance in the Fresnel Zone, they can operate in the Fresnel zone over a very long distance in relation to and depending on their large size if the wavefront doesn’t encounter obstacles and the line array posisioned far from any obstacle or surface.
SPL Decrease in the Fresnel Zone
It can vary depending on the specific shape and frequency so no precise rules can be given, however, line arrays, due to their cylindrical-like wave propagation in Near Field, may exhibit a decrease in sound pressure level closer to 3 dB per doubling of distance compared to the 6 dB rule of the far field.
Transition Distance
The transition distance marks the point where Fresnel zone with their spherical wave transform into the far field’s characteristic flat wavefronts. This distance depends on several factors, including:
-
Source Size: Larger sources generally have a larger near field compared to smaller sources at the same frequency.
-
Sound Frequency: Lower frequencies tend to have a larger near field compared to higher frequencies for a given source size.
It’s important to note that in case of single source, the near field end when Fresnel zone basically end, but not for combined source like SBA or Line Array where Fresnel zone ends way further.
For a cone, dome and compression drivers :
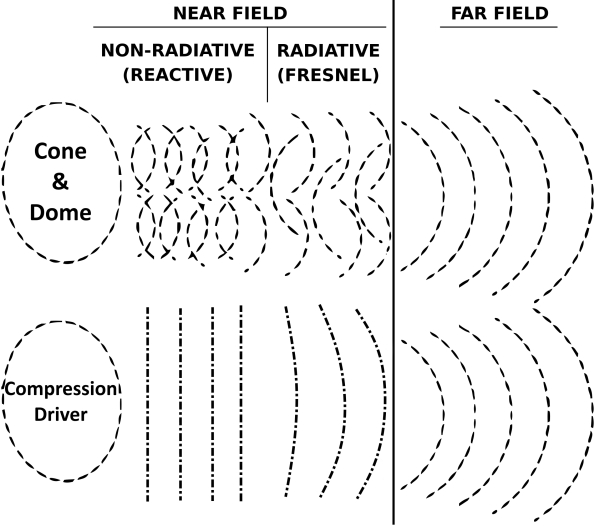
For compression driver, the wavefront at the phase plug exit remains approximately planar, even after the diaphragm ceases to behave pistonic. Only when the diaphragm enters breakup modes does the radiation deviate from a plane wave, producing local phase and amplitude irregularities varying with frequency, while the horn is still designed for a planar wavefront, resulting in significant alterations of the directivity pattern in this frequency region, usually at very high frequencies.
In Line Array case :
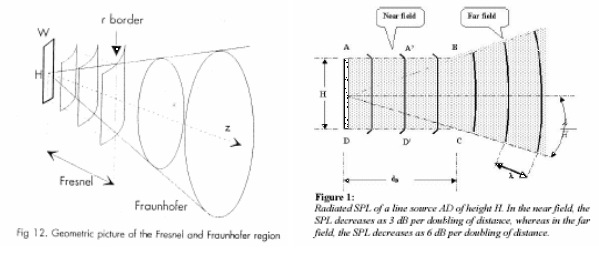
Formula can be found in Appendix.
Far Field (Fraunhofer Zone)
The far field, also known as the Fraunhofer zone, is the region where sound waves are considered to have minimal curvature. This characteristic allows for straightforward calculations and predictions of sound propagation through a space.
Behavior of Different Sound Sources in the Far Field
While the wavefronts in the far field are more predictable for all sources compared to the near field, there are still some subtle differences in how different sound sources radiate sound:
-
Cone and Dome Drivers: In the far field, cone and dome driver sound pressure follows the inverse square law for the most part. However, for large drivers, at the edges of the radiating area, there might be a slight roll-off in high frequencies due to diffraction effects. The interaction of the driver’s wavefront with the enclosure edges can also contribute to bending it towards a more rounded shape, further influencing the far-field behavior.
-
Compression Drivers with Horns: Once the sound wave exits the horn in the far field, it generally follows the inverse square law. However, the horn’s directivity pattern (how it focuses sound in specific directions) determines how the sound pressure is distributed in the far field, the midrange narrowing if present and horn mouth will also impact wavefront edge.
-
Line arrays: Line arrays, due to their design, tend to maintain a more coherent wavefront over a larger area in the far field compared to point source speakers like cone and dome drivers. This translates to a more consistent decrease in sound pressure with distance according to the inverse square law within the coverage area of the line array.
SPL Decrease in the Far Field
In the far field, sound pressure level (SPL) generally decreases by approximately 6 dB for each doubling of the distance from the source. This phenomenon is known as the inverse square law. It allows for simpler predictions of sound level at different distances in the far field. This decrease occurs because the wave propagation is spherical, and the expanding wavefront covers a much larger surface area with increasing distance.
Walls effect
In Far field and in a room , the shape of a wavefront typically changes, transforming into a plane-wave like behavior due to three factors.
Firstly, like a wave in a tube, the wavefront in a room can’t expanding infinitely on its sides, walls act as barriers, forcing the spherical wave to interact with them.
Secondly, wavefronts tend to travel perpendicular to the surfaces they encounter.
Thirdly, the further the wavelength propagate in the room, the more the circle section looks flatter in the room point of view.
This interaction with the walls essentially reshapes the wavefront, transforming its curvature into a more planar form as it propagates further within the room.
Here is the extension from a single point source in blue and the 90° interaction with walls in red dots:
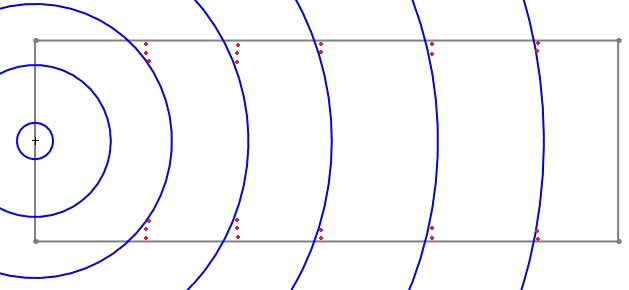
note: This is a over simplified schema for underestanding purpose, reflections (on objects and walls) and frequency wavelength will affect it.
Composed Sources
In audio, a composed source refers to sound originating from multiple, distinct primary locations that combine to create a single perceived auditory event. These individual locations act as single primary point sources, each radiating sound waves. The combined effect of these waves creates the final characteristic of the composed sound after a certain distance.
- Multiple Primary Point Sources: Unlike a single-point source where sound originates from one location, a composed source involves several sound-emitting points.
- Combined Sound Waves: The sound waves from each individual point source interact and add together to form the final perceived sound.
- Examples: Instruments like pianos, violins, and drums are classic examples. Even a human voice can be considered composed as different vocal tract sections contribute to the overall sound.
Composed Sources in Audio
-
Line Array: A line array functions more like a composed source. It consists of multiple speaker elements arranged in a line. Each element acts as a primary sound source, and their combined radiation pattern creates a specific directivity for the sound. This allows line arrays to project sound over longer distances and control its vertical spread.
-
SBA (Single Bass Array): While named “array,” an SBA often behaves acoustically like a single-point source at low frequencies. It achieves this by strategically placing four or more subwoofers (typically 18" or 21" woofers) on the front wall at approximately 20% of the distance from the room boundaries (walls, ceiling, and floor). This configuration creates a rectangular virtual source that radiates low frequencies in a plane-wave radiation, more uniformly than a single subwoofer.
For sound propagation purposes, an SBA can be considered as a single source, especially at low frequencies where the wavelengths are large compared to the subwoofer spacing.
Plane Wave Radiation when single source combines:
The near field for an 18" subwoofer is around 3 cm at 30hz. Within this zone, the sound behaves chaotically. Beyond the near field (around 3cm), the wavefront transitions into a spherical pattern.
Even though a line array and SBA behave like a composed source, each individual speaker element within the line array will still have its own near field region. This is because the near field depends on the size of the individual element and the wavelength of the sound it produces.
As the spherical waves propagate further, they combines in Far Field in a way that creates a plane wave radiation pattern, creating a Fresnel zone outside and after the near field, but not as an instantaneous process.
-
In the case of an SBA, the strategic placement of subwoofers creates a larger virtual source compared to a single subwoofer. This larger virtual source, combined with the influence of walls in a room (as seen in “Walls effect”), contribute to a more persistent planar wavefront behavior at low frequencies within the listening area.
Here with a absorbing materials at rear wall for absorb incoming wavefront from front wall:
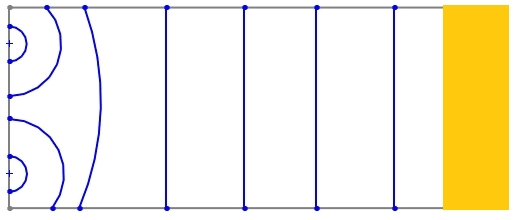
-
Line arrays, due to their length, will also exhibit a planar wavefront within a certain distance (defined by the Fresnel zone and line array length). However, this planar behavior weakens as the distance from the line array increases, and the wavefront transitions back to a more spherical pattern.
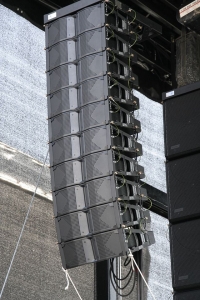
Additionally, it’s important to remember that even these planar wavefronts are not perfect. If a plane wave encounters an object like a sofa, it will diffract, or bend, breaking the plane wavefront and leading to a more complex wave pattern.
In the case au SBA and in more than we have said upper, asymetrical room will not allow a true SBA plave wave front behavior.
DBA
A Distributed Bass Array (DBA) leverages an opposed second SBA to nullify pressure waves generated by the first main SBA.
This cancellation, achieved through phase reversal and delay, effectively reduces low-frequency reflections within the room, leading to improve modal regime and modes.
Here is a simplified representation of wave interference. The blue wavefront represents the original wave, while the red wavefront represents a wave introduced to cancel it:
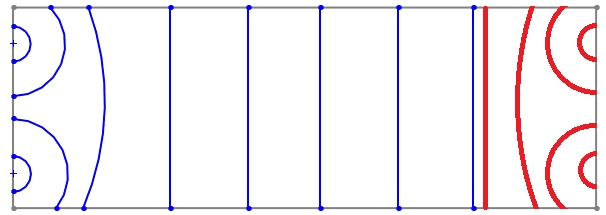
This approach targets low frequencies and doesn’t participate to overall pressure level, the DBA cancellation system works up to 80/100hz in optimal acoustic conditions (obstacles).
The system consumes some SPL pressure so at very low frequency it may be interesting to stop the cancellation DBA effect and use all the subwoofers in phase with delay to maintain SPL, depending on room gain and acoustics.
A suffisent absorbing material on a significant deep (at least 80cm) on rear wall will aslo bring a fair enought reduction of this incoming wavefront as seen with SBA.
Wavefront Behavior and Diffraction
The wavefront travels at the speed of sound, which is constant in a given medium.
The edges of the wavefront are always perpendicular (90°) to the profile of the source.
This schema just show the theory:
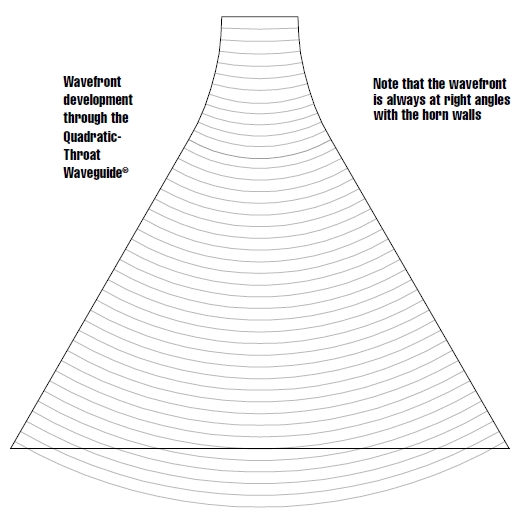
However, sudden changes in the source’s profile, like the end of a horn or the baffle itself, can disrupt this ideal behavior and can cause over-diffraction.
Diffraction is the phenomenon of sound bending around obstacles or edges. This effect becomes significant when the wavelength (λ) is larger than the obstacle.
When the wavelength is smaller than the obstacle, sound behaves more like a ray of light. It is blocked by the object, creating an acoustic shadow zone behind it. As frequency increases (shorter wavelengths), the natural off-axis radiation diminishes due to beaming effects (when the wavefront leaves the surface and energy concentrates along the forward axis), making the sound more directional and more sensitive to small obstacles, such as a protruding screw. The sound forms a forward-directed beam, leaving the surface, reducing energy behind the object.
In loudspeaker design, it can occur when sound waves encounter the end of a horn, the edges of the cabinet, or other abrupt changes in the source profile.
This bending of the wavefront, if too pronounced, can generate over-diffraction and affect the on and off axis frequency response of the loudspeaker, introducing unwanted effects like:
Midrange narrowing: Describe here, A very large dip in the frequency response on and off axis in the midrange frequencies.
Beaming: The concentration of sound in a specific direction caused by the wavefront peeling off the horn profile, reducing off-axis radiation.
To minimize these issues, loudspeaker designers strive for smooth transitions in the source profile to avoid creating sharp edges or mouth that can cause significant diffraction.
Beaming Effect
Beaming is caused by the inability of the wavefront to maintain conformity with the horn profile when the wavelength becomes comparable to or smaller than a characteristic horn dimension (such as the mouth or local profile radius).
The wavefront naturally propagates perpendicular to the horn walls (≈90° relative to the surface) at all frequencies. At long wavelengths, diffraction around edges allows the wavefront to follow the horn curvature smoothly, resulting in broad dispersion with minimal directivity.
As the wavelength decreases relative to the horn geometry, the wavefront can no longer perfectly follow abrupt curvatures or transitions, and it detaches or “peels off” from the horn—a phenomenon sometimes referred to as over-diffraction. This detachment concentrates acoustic energy along the horn’s axis, producing a forward-directed beam.
Abrupt changes in flare rate, mouth geometry, or diaphragm size can exacerbate this effect, generating on-axis lobing and irregularities in the radiated wavefront.
Both direct-radiating drivers and horn-loaded drivers exhibit this phenomenon when the wavelength approaches or falls below the relevant horn dimensions, influencing perceived tonal balance, spatial coverage, and sensitivity to obstacles or room boundaries.
Radiation Space and “room gain”
Radiation space is a solid angle that characterizes the measurement context:
- 4π: whole sphere, measurement without a wall (on a mat for example)
- 2π: hemisphere, so one wall considered infinite
- 1π: quarter sphere, so two walls considered infinite
- 1/2π: 1/8 of a sphere, so 3 walls considered infinite
It will impact “low loading” of the speaker :
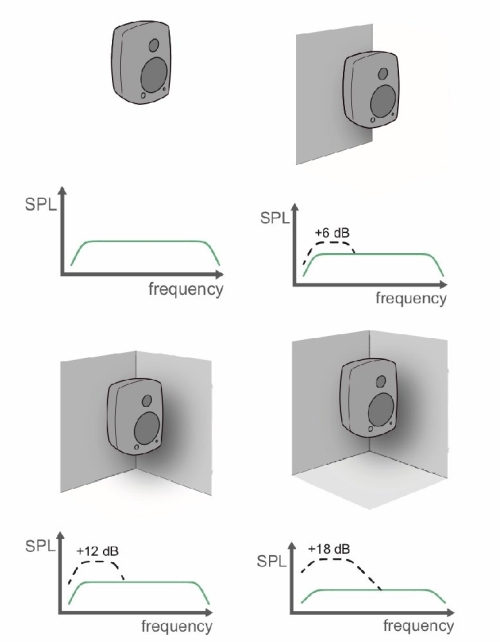
Additional Information
- The speed of sound in air is approximately 340 meters per second (m/s).
- The wavelength of sound (so called Lambda: speed of sound/Frequency) is inversely proportional to its frequency.
Appendix: Transition Distance Formula
For a circular radiating surface:
Zf = (2 * D^2) / λ
Where:
- Zf is the distance to the beginning of the Fraunhofer zone (meters)
- D is the diameter of the radiating surface (meters)
- λ (Lambda) is the wavelength of the sound (meters)
For a rectangular radiating surface:
Zf = (2 * a^2 * b^2) / (λ a + λ* b)
Where:
- Zf is the distance to the beginning of the Fraunhofer zone (meters)
- a is the length of the radiating surface (meters)
- b is the width of the radiating surface (meters)
- λ (lambda) is the wavelength of the sound (meters)
Calculating Lambda:
λ = c/F
Where:
- F is the frequency of the sound (Hz)
- c is the speed of sound (approximately 340 m/s in air)
![]()
The Sound
Sound, a ubiquitous pressure wave, carries information and shapes our auditory experience.
However, its journey from source to ear is not always a straight line.
Two fundamental concepts, diffraction and standing waves, play a crucial role in understanding how sound interacts with its environment and ultimately affects sound reproduction.
Diffraction
When sound waves encounter an obstacle or a narrow opening, a phenomenon called diffraction occurs. Here, the wavefront, the edge of the wave carrying the disturbance, doesn’t simply stop. Instead, it bends around the obstacle, constantly striving to maintain a 90-degree angle with the encountered profile. This characteristic allows sound to travel around corners, through gaps, and even diffracted through small openings, shaping its overall propagation pattern.
The concept of maintaining a 90-degree angle is crucial as seen in Wavefront Propagation article. As the wavefront bends, different sections travel slightly different distances. However, the speed of sound remains constant throughout the entire wavefront. This interplay between the bending wavefront and the constant speed of sound is what governs the overall behavior of diffracted waves.
Examples of Diffraction
-
Non-continuous geometry: Sound travels as pressure variations in a medium like air. Inside a horn or on a baffle, the geometry can significantly impact how sound propagates. If the shape has abrupt changes or isn’t a “fluid profile,” diffraction will occur.
-
Obstacles in the path: If an object sits in the path of the sound wave, diffraction causes the wave to bend around it. While some sound is blocked, some will diffract, creating a partial shadow effect. Depending on the size and position of the obstacle, the sound might diffract significantly, reducing its effectiveness. (e.g., woofer below a tweeter section)
-
Phase shield: A phase shield is a small obstacle placed a few millimeters in front of an audio source like a dome tweeter for mainly create diffraction based directivity in high frequency.
While it acts as a barrier, a phase shield uses diffraction to create a high frequency sound direction when a phase plug on the other hand, achieves optimal directivity with a plane wave behavior, avoiding diffraction for clearer, more accurate sound.
Baffle Step and Edge Diffraction
When a horn or sound source mounts onto a flat surface (baffle), a sudden change in geometry disrupts the wavefront. This discontinuity creates two key effects:
-
Baffle Step and Directivity: As sound waves from the source reach the baffle’s edge, they diffract outwards (edge diffraction). This diffraction interacts with the sound waves traveling directly from the source. Depending on the baffle size relative to the wavelength, these interactions can cause:
-
Baffle Step: A dip in sound pressure at the edge due to destructive interference between the direct and diffracted waves. The size of the baffle influences the severity of this dip. Larger baffles can mitigate baffle step at lower frequencies.
-
Directivity: Edge diffraction can also affect the overall directivity (focusing) of the sound, especially at higher frequencies with shorter wavelengths.
Note: While baffle step introduces a dip in sound pressure, the overall surface area of the baffle can still contribute to a gain in radiated sound energy compared to a point source. Baffle Step article explores this phenomenon in more detail.
Diffraction on woofer
Even with a smooth profile, the physical presence of the woofer, positioned vertically, will influence the vertical response and, to a lesser extent, the horizontal response.
Here’s why, as illustrated by the pressure level from 1 to 10 kHz when the horn or waveguide radiates sound:
We can observe the impact of diffraction on the woofer’s shape.
The closer the woofer is to the high frequency device, the more pronounced the diffraction, especially if the implementation is not perfect or if the woofer surround is very prominent. This phenomenon has an impact on the vertical polar plot.
From the woofer’s perspective, the wavefront continues inside the horn, creating a kind of virtual or phantom source, we can observe it here from 200 to 2000 Hz:
This also explains why the horn tends to be the overall virtual point source of emission for the entire speaker, while in a regular speaker, it’s between the tweeter (in direct radiation) and the mid-woofer.
These diffractions significantly affect the vertical polar response and even the horizontal one when components are very close. This diffraction, present in all speaker designs, becomes more problematic when a waveguide is added to the mid-woofer and the vertical center-to-center spacing is less than 17-20 cm.
Worst Case: Adding a Square Waveguide to the Mid-Woofer
Here are two polar plots of a tweeter waveguide, one with the horn alone and another with a mid-woofer also using a waveguide at a center to center distance of 15 cm, but with the mid-woofer not emitting sound.
- Horizontally:
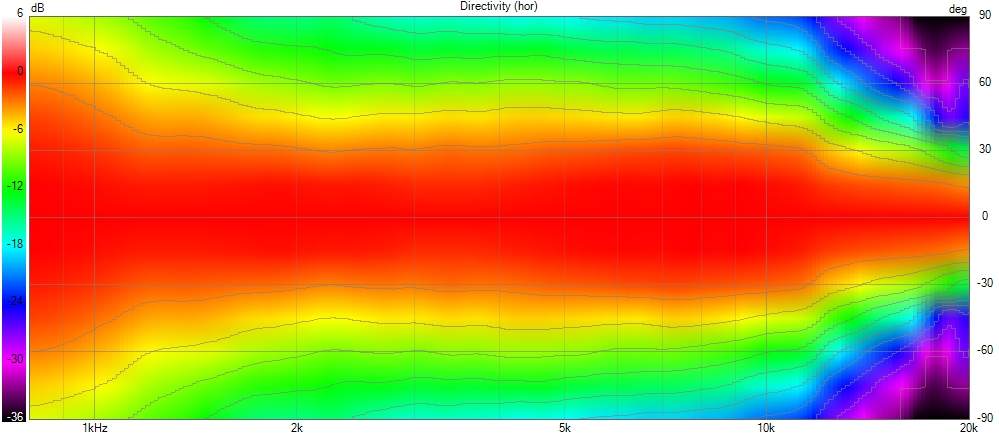
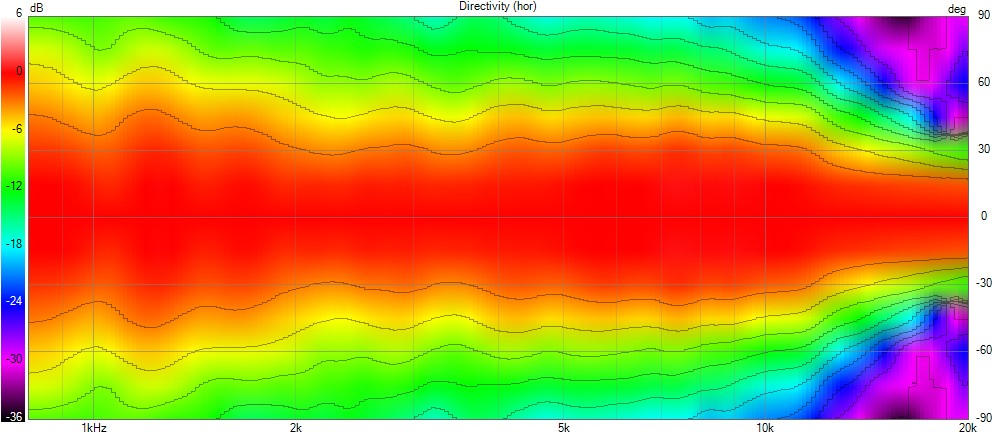
- Vertically:
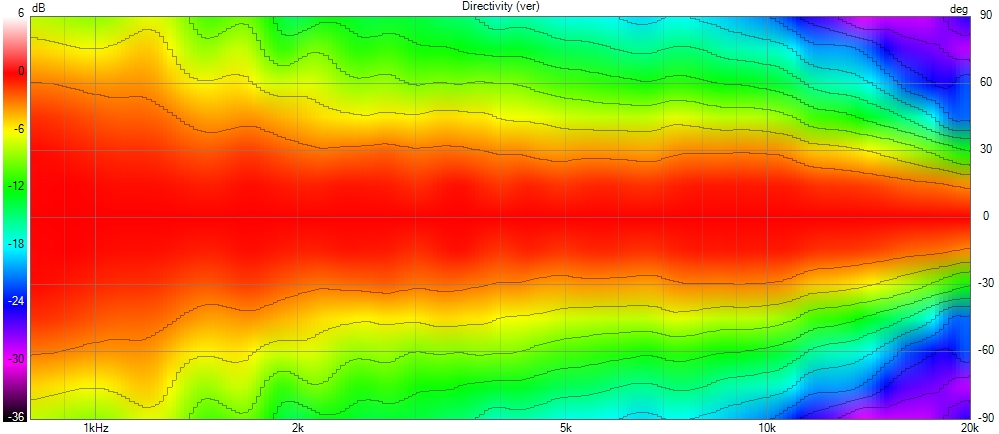
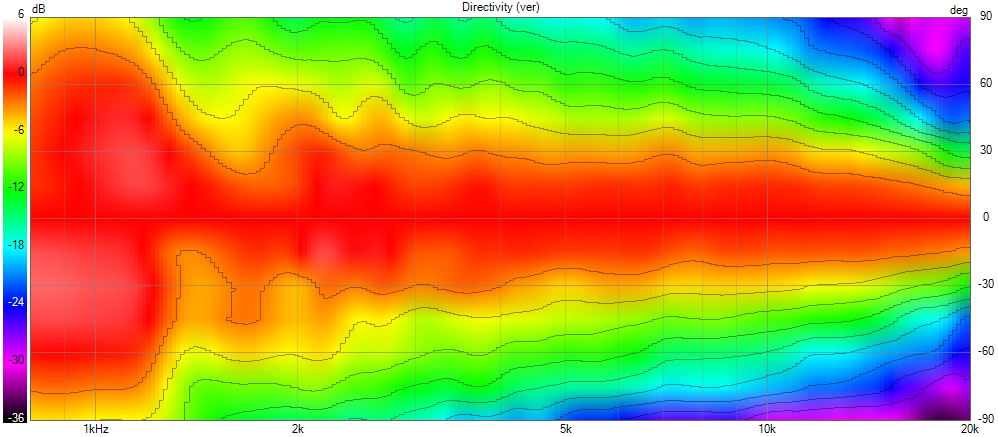
Therefore, when the vertical center-to-center spacing between two components is less than 17–20 cm, the problem is worsened as in our current example. Adding a waveguide to the mid-woofer in this situation should be avoided.
An MTM arrangement will also exacerbate the problem.
Why it becomes less impacting when vertical center to center increase ?
By increasing the distance, you slowly move the impacted frequency range downwards so the impacted wavelength becomes larger, the impacted energy level also decreases slightly. But this frequency range will remain wide.
To increase the distance without introducing lobe problems, you will need to lower the crossover frequency so to use a larger horn so a bigger mid-woofer too.
Increasing vertical spacing allows longer wavelengths to pass through, reducing the obstacle’s (woofer surround or woofer shape) impact. Consequently, the obstacle appears less significant from the perspective of these longer wavelengths.
Technically: By increasing vertical spacing, the obstacle becomes less effective at obstructing longer wavelengths. This reduces the obstacle’s apparent size or “visibility” to these wavelengths.
We can argue that if we increase the distance and lower the crossover frequency, the woofer, as well as the horn, will be bigger. Consequently, the woofer’s surround will also be larger. Even if the impacted wavelength is larger, the woofer’s surround will still be a visible obstacle due to its increased size.
However, the wavelength will increase faster than the woofer surround size, ultimately reducing the woofer’s surround diffraction impact by increasing the vertical distance with the high frequency component. Of course, it will requires larger components and a lower crossover frequency.
Coaxial or MEH Diffraction
Diffraction also applies to coaxial or MEH. It can even be worse, as the obstacle – for example, the coaxial surround – is completely symmetrical around the center of emission.
This concentrates the problem and makes it even more pronounced if the surround and/or any other possible obstacles are not smoothed. These concentrated artifacts further affect a directivity that is already less uniform and clean than that of a well-implemented constant directivity horn.
The polar responses of these systems can be seen in the MEH and coax sections of our MTM, 2.5 or 3 voices article.
Standing Waves
In contrast to diffraction, standing waves occur when a wave reflects off a boundary and interferes with itself.
The reflected wave can either add up (constructive interference) or cancel out (destructive interference) with the incoming wave, creating specific points of vibration and stillness.
Standing waves are less relevant within the horn itself if the horn has a smooth profile, but they can appear at the horn mouth, contributing to midrange beaming when the termination is abrupt or non-smooth.
These standing waves can cause midrange beaming, our Mid-range Beaming And Narrowing article goes deep in these two concepts.
Understanding Wave Behavior: Diffraction vs. Standing Waves
It’s important to clarify that diffraction doesn’t actually break the wavefront into separate pieces. Instead, the wavefront itself bends and spreads as it encounters obstacles or openings.
In contrast, standing waves arise when reflections occur at abrupt edges or non-smooth terminations, creating waves that interfere with the original wavefront. The reflected wave can superimpose on the original, creating regions where the peaks (crests) and troughs (valleys) reinforce each other (constructive interference) or cancel each other out (destructive interference). These regions of reinforcement and cancellation create a stationary pattern of vibration, hence the term “standing wave.” The wavefront itself, however, remains intact.
Coloration and Wave Interactions
Diffraction and standing waves, while interesting phenomena, can introduce unwanted colorations to the sound. These wave interactions can emphasize or weaken certain frequencies, leading to an uneven and distorted representation of the original sound.
For instance, diffraction around obstacles or improper horn design can bend the wavefront around obstacles, sometimes even partially destroying it, leading to frequency-dependent dips and uneven high-frequency response.
Similarly, standing waves can introduce peaks and nulls in the listening area, boosting or canceling specific frequencies.
These effects can manifest as a thin or bright sound lacking body, or an overly harsh and emphasized high-frequency range.
By understanding these wave interactions, we can design audio systems that minimize coloration for a more accurate sound reproduction.
![]()