In this article, we assume a typical living room environment — not a dedicated room or recording studio, a basic living room that is usually very reverberant.
We will avoid creating coupled volumes; closed doors are always preferable to prevent this effect.
Rear and Front Walls
The ideal place for absorption is the wall behind the speakers, as this accounts for about 80% of the reduction needed in room reverberation time (RT).
Use melamine foam (e.g., BASF Basotect G+) or rockwool (e.g., Rockfeu REI, bi-density — place the low-density side facing outward) over a large portion of the wall, prioritizing exposed surfaces near corners.
The treatment should be substantial, at least 8–10 cm thick, covering at least 50% of the wall, focusing exclusively on absorption.
To better control lower frequencies, this treatment can be extended to the wall behind the listening position, while some reverberant components can be preserved to maintain a deep soundstage.
Avoid placing your listening position directly against the wall — maintain at least 1 m distance.
Side Walls
Their effect depends on the loudspeaker directivity: When the directivity is adapted to the listening distance — typically around 90° in a regular living room — the lateral energy is already close to an ideal balance, so we can focus on the quality of these primary reflections. Without this adaptation, lateral energy may be excessive, requiring heavy absorption.
Consider treating the side walls using a combination of diffusive and absorptive elements placed side by side. If the loudspeaker directivity is already adapted to listening distance, the absorptive component can be reduced, and in some cases, removed in favor of the diffusive element.
Avoid products that combine both diffusion and absorption in one material, as they tend to produce a “V”-shaped absorption curve, which is undesirable.
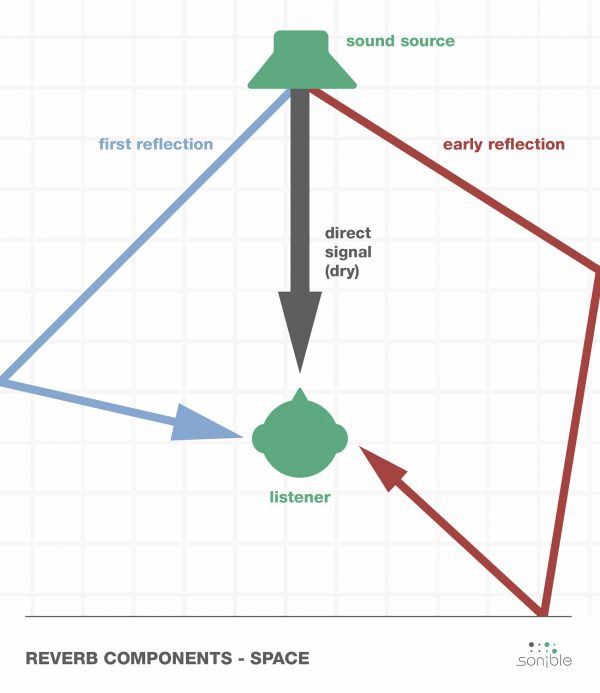
Early reflections are the first sounds that bounce off nearby surfaces, such as side walls, floors, and ceilings, before reaching the listener.
These reflections arrive within the first 20–30 ms (the Integration Time (IT) window)
and are perceived as part of the direct sound rather than separate echoes. Their characteristics—dependent on frequency, distance, sound complexity, room geometry, and listener factors such as age—affect imaging, stereo perception,
and listener envelopment. For more details about soundstage, see our Listener Envelopment and Early Reflections article.
Sidewall treatments should be chosen according to loudspeaker directivity and room conditions. Diffuse absorption helps prevent mirror-like, or specular, reflections that degrade imaging and the horizontal soundstage, while in some cases, lateral absorption near the speaker corners is required, particularly in dedicated rooms, to absorb the very first reflections arriving within the initial 10–15 ms of the direct sound.
Untreated early reflections can cause phantom image shifts or soundstage asymmetry, especially in asymmetrical spaces or when speakers are placed close to walls.
In studio environments, where only the direct sound field is desired, absorption is generally applied everywhere.
Over-damping the lateral walls can create a nearly dead room and collapse the horizontal soundstage.
When horizontal directivity is well matched to the room and listening position — typically around 90° in a domestic living room — lateral absorption can be minimized or even omitted in living room.
This allows the focus to shift, if needed, to quadratic diffusers, which redistribute reflections without producing specular effects, preserving the lateral energy needed for listener envelopment and a wide, coherent soundstage.
In a regular living room, furnishings and furniture can provide a naturally diffuse reflection regime so when the loudspeaker directivity is adapted to the listening distance (around 90° in a typical living room), sidewall treatment may be unnecessary, with little or no need for either absorptive or diffusive elements. This is one of the advantages of adapting loudspeaker directivity to the listening distance.
Some early reflections are still desirable to support the soundstage, but they must be controlled: not too intense, and not too close in time to the direct sound.
If they arrive too early, or if the speakers are placed too close to the side walls, tonal degradation and comb-filtering effects can occur in the mid and high frequencies.
Toeing-in the speakers and using horns with directivity matched to the listening distance will help reduce the level of these early reflections.
The auditory system integrates early sound within a specific time window, known as the Time Period of Integration (TPI).
You can find more information about TPI here.
![]()
What is a compression driver and comparison with dome Tweeter
A compression driver acts as a high-volume plane wave generator, unlike a regular tweeter, so their design and usage differ.
While it is possible to control and select the radiation angle of a compression driver, achieving this with a regular tweeter is more challenging.
We usually talk about waveguides for tweeters and horns for compression drivers.
Due to their limited SPL capabilities, tweeters are usually dedicated to close-range or monitoring applications.
Throat Size
The throat size generally dictates the high-frequency control of the horn, and thus its constant directivity behavior.
The larger the throat size, the less high-frequency control we have. However, there are design tricks to mitigate this, as seen in our bi-radial horn or X-Shape / MX-Shape horns.
1" compression driver:
They are relatively inexpensive but cannot go very low in frequency. The best among them have a low-frequency limit around 950–1000 Hz (BMS and 18Sound).
The throat is tiny, so the radiation control occurs at high frequency.
2" compression driver:
This is a historic size with limited high-frequency control.
Today, some 2" drivers can be still used for very specific applications such as providing high SPL and low-end response without regard for top-end directivity control.
Using 2" compression drivers is not recommended for our typical usage.
1.5" or 1.4" compression driver:
This size is ideal, offering lower frequency extension with a moderate throat size.
Most “2 inch” drivers are actually 1.5" drivers with built-in adapters, like the JBL 2450 or TAD TD4002.
From the horn’s perspective, it is more efficient to use a true 1.5" driver rather than a 2" version.
1.4" drivers have a 3" or 3.4" diaphragm, which pushes breakup frequency higher.
1.5" drivers have a 4" diaphragm, allowing better max SPL and lower distortion at low frequencies.
On our 1.4/1.5" Bi-radial horn, we use a smooth pinch to push the control as if it were a 1" throat, combining the best of both worlds.
We apply a similar principle in the X-Shape and MX-Shape horns.
Exit Angle & Flare
A compression driver has an exit angle, sometimes referred to as rapid flare vs slow flare. This is the exit angle of the device in degrees, usually given as a semi-angle. For example, a TD 4002/4003 has a semi-angle of about 4–4.5°, so the full coverage angle is roughly 8–9°.
The larger the flare, the more difficult it is to smoothly transition to the horn’s coverage angle (e.g., a semi-angle of 45°, or full coverage 90°).
Some compression drivers have a large semi-angle, called rapid flare, which is not ideal for our applications.
We prefer slow flare angles, as close to 0° as possible. The JBL 2450SL has a 0° flare (no flare), which is why this driver is generally recommend for 1.5" application; it’s also available used at reasonable prices.
The 1.4" 18Sound ND3 family and FaitalPRO HF1440/1460 also have slow flare angles, which suits our needs well.
Note: Regarding diaphragm materials, Truextent’s Be is embossed beryllium, not vapor-deposited Be like TAD uses (which is more expensive). So even if it’s Be, it is quite different from TAD’s process.
Setting a new diaphragm precisely in a compression driver is difficult, although modern drivers make this easier. Diaphragm characteristics are integrated into the overall device design, so swapping diaphragms doesn’t always yield improvements—and sometimes can worsen performance. Be cautious when changing diaphragms.
![]()
Why DSP ?
Active crossover with DSP is advised for horn speakers: The energy in the horn is defined at the begining and as we want a constant directivity behavior the on-axis horn response will show a bell shaped response, as explained here in Horn & Energie.
It would be very hard to do a passive crossover for a high efficiency horn speaker.
DSP PlateAmp : The Hypex Fusion Amp
The Hypex Fusion Amp line-up are state of the art Class D + DSP :
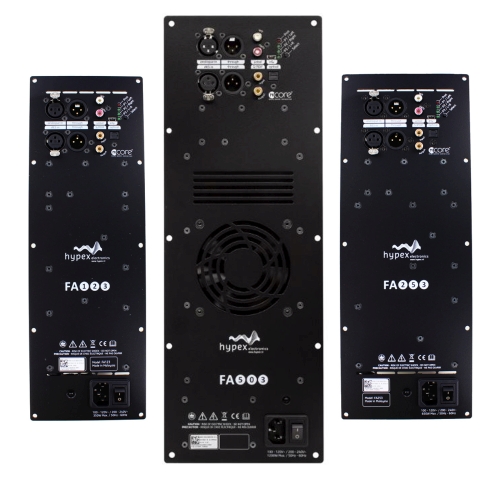
They have FIR capacities, powered by the Hypex Ncore MP family.
They have all possible inputs including AES/EBU and even a remote control for sources and volume so they act also as a pre-amp.
A passthrough allows adding a sub.
Mini DSP Flex HTx
The Flex HTx, and not the “HT”, is a 8ch IN (USB/HDMI/Analog) or 2ch IN (Toslink/SPDIF) to 8 channels OUT asymmetrical and symmetrical analog.
Powered by a SHARC CPU, the best one.
The capacity to accept multicanal on HDMI E-ARC input is very rare for a DSP and routing capacities allow it to easily add a sub.
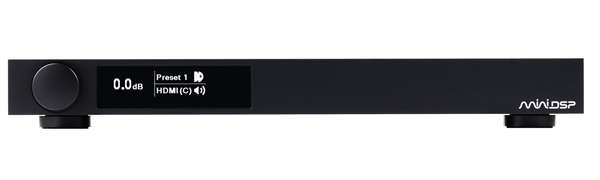
It need to be paired with amp, with symmetrical analog output.
Pro solution, the Xilica Solaro FR1
The FR1 is a DSP with extended card for almost everything except HMDI, he can be in network thanks to DANTE and manage until 64 channels.
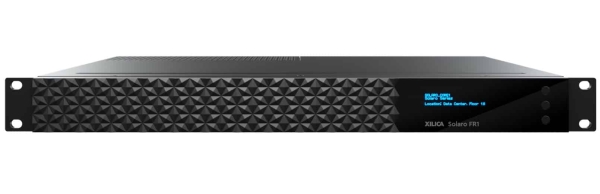
It need to be paired with block or pro amp, with symmetrical analog output.
Do Speaker Cables Need to Be Twisted?
We twist conductors to reduce electromagnetic interference — in practice, this helps cancel out the magnetic fields generated by the opposing currents. This is especially useful for low-level signals, like those coming out of a DAC, where even small EMI from the environment can degrade audio quality.
With amplified signals, such as those going to speakers, it’s a different story: the voltage and current are much higher, so the signal is far less sensitive to external interference. In that case, twisting the wires is mainly about reducing what they emit — to avoid polluting nearby low-level cables (RCA, microphones, etc.) with electromagnetic noise.
But if the speaker cables are short and there’s nothing sensitive nearby — typically the case inside a speaker enclosure — the benefit is negligible or even nonexistent. In such situations, twisting simply doesn’t matter.
That said, especially in subwoofer builds, you should still make sure the cables aren’t loose inside the enclosure. Strong vibrations can cause wires to flap against the driver basket or diaphragm, which can lead to buzzing or rattling noises — completely unrelated to EMI, but just as annoying. Tie them down or route them away from moving parts.
![]()
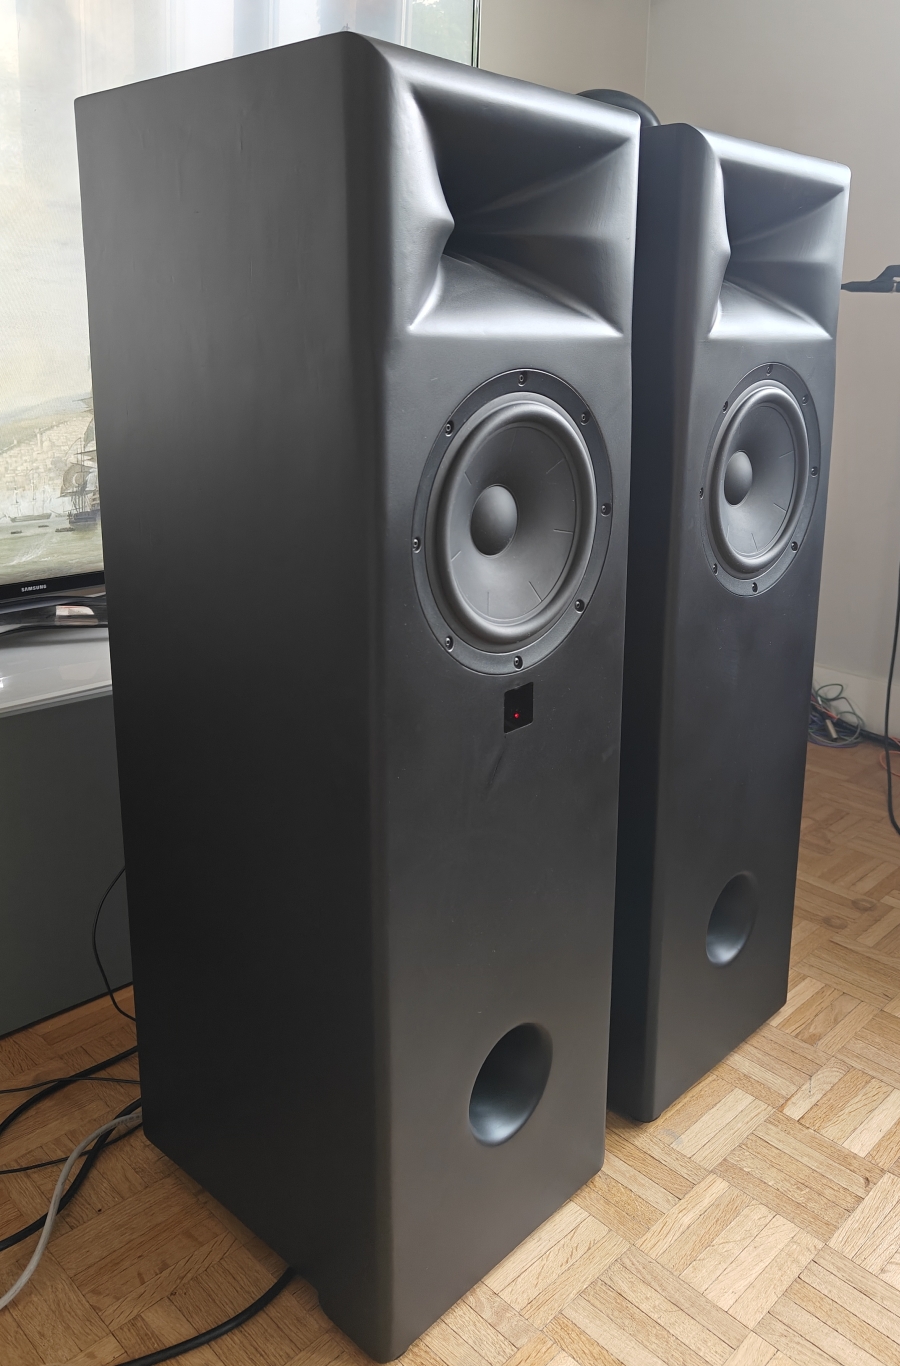
MTM: A Trade-Off in Speaker Design
The MTM (Mid-Tweeter-Mid) speaker configuration offers advantages as high SPL capacties, but it also comes with challenges related to vertical lobing.
This article will describe specific mounting impact on the directivity, as mentionned in other article we listen at the so called critical distance where direct and reflected sound (from walls) are roughly balanced (50/50).
This impact on the directivity will also impacts the listening in-room experience, even when we are positioned in front of the speakers.
This article need a good comprehension about vertical lobing.
The MTM Lobing Issue:
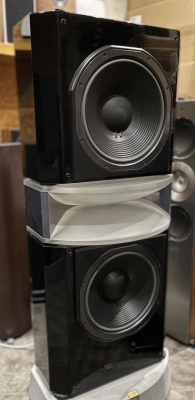
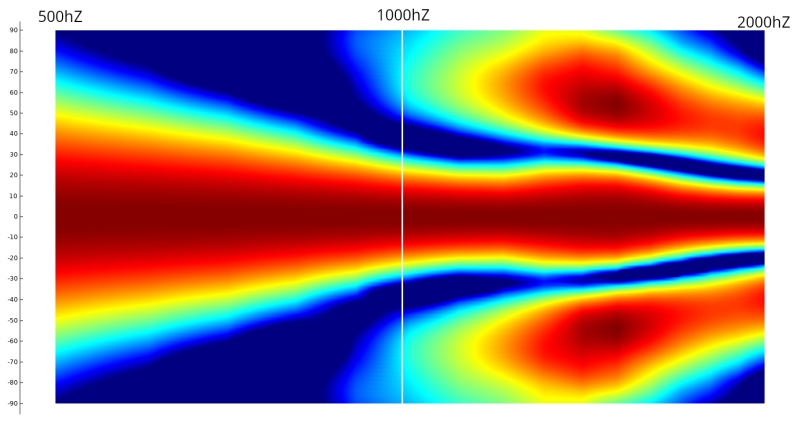
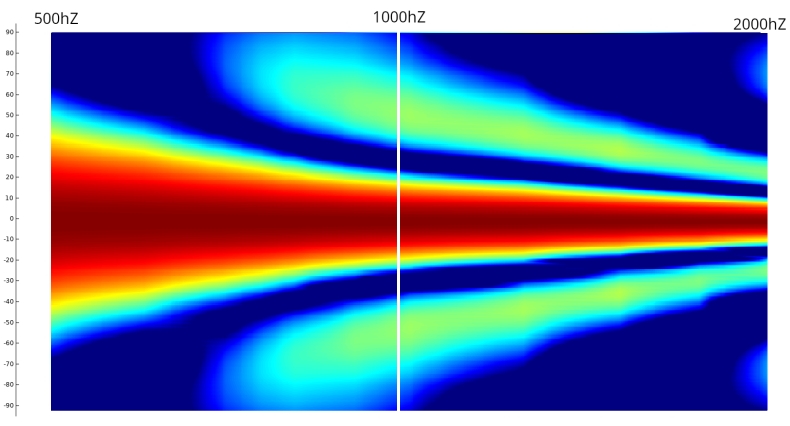
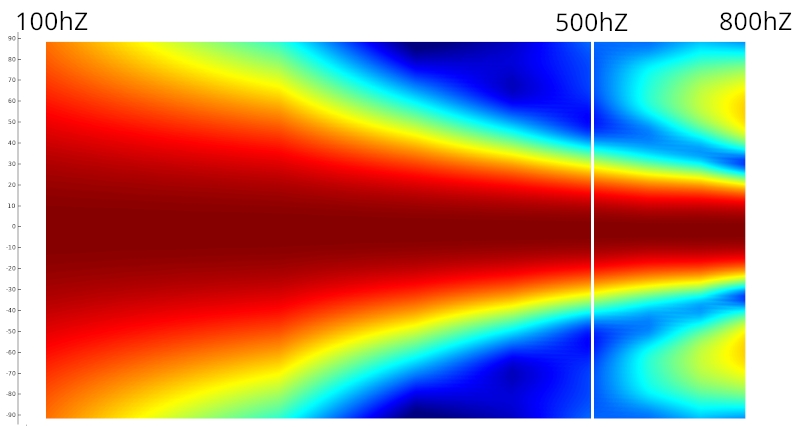
Placing two woofers in an MTM design increases the distance between their acoustic centers compared to a single woofer. This larger spacing can lead to vertical lobing, causing cancellation effects at certain frequencies, particularly when listening off-axis (from the side).
Here’s an image representing the difference in vertical off-axis response of a MTM design with Faital 12FE120 25cm spaced to let 12cm for the tweeter or the waveguide:
The MTM Vertical Directivity Issue
In an MTM (Midwoofer-Tweeter-Midwoofer) configuration, waveguides are often truncated to fit within enclosure constraints.
When the vertical aperture of the waveguide is reduced, for example from 60° to 40°, vertical directivity control is lost much earlier than intended—well before the horizontal control is lost, which typically aligns with the crossover frequency.
This results in three distinct phases: a controlled 40° vertical dispersion, a sudden transition to a much wider pattern (e.g., 95°-110°) when control is lost, and then an over-narrowing effect caused by vertical lobing.
Additionally, the loss of vertical aperture reduces acoustic loading, which further impacts the horn’s efficiency.
The MTM Diffraction Issue
Another critical issue with the MTM layout is vertical diffraction. The wavefront from the waveguide interacts with the two symmetrically positioned midwoofers, effectively encountering two reflective sources above and below. This symmetrical diffraction not only reinforces interference artifacts but also leads to an increase in diffraction energy, multiplying its impact.
From the perspective of the waveguide, the sound front interacts with both woofers as additional sources of diffraction, significantly affecting polar response. The smaller the waveguide and the closer the midwoofers, the more pronounced this effect becomes, regardless of the crossover frequency.
Additionally, even the horizontal polar responses are negatively impacted by the vertical symmetrical double diffraction effect caused by the symmetrical placement of the woofers. This amplifies inconsistencies in dispersion, making the overall response less predictable.
Combined with the presence of vertical lobing, these factors contribute to a disrupted and inconsistent radiation pattern.
Addressing the Issue in MTM:
While MTM presents a lobing challenge, there are ways to mitigate it:
-
Lower Crossover Frequency: In MTM designs, using a lower crossover frequency for the woofers can help reduce lobing. However, this asking more power for the compression driver and can be hard to achieve or even lead to a burned compression driver.
-
2.5-Way Design: If you’re set on an MTM layout, a 2.5-way crossover design can be a solution. In this design:
-
The bottom woofer is crossed over with the tweeter at a higher frequency.
-
The other woofer is crossed over at a lower frequency and compensated baffle step loss.
This approach helps maintain a good on-axis response while minimizing lobing effects and keeping high SPL capacities.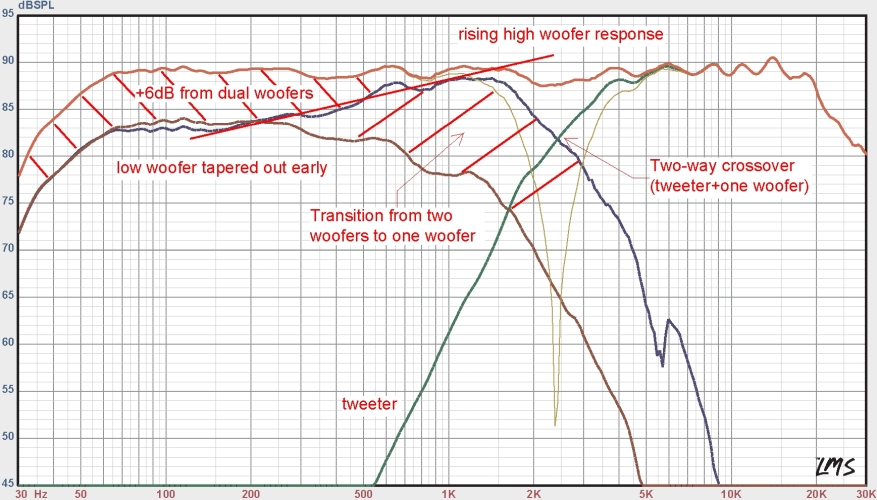
This approach was also helpful to maintained a good sensitivity for passive speaker, for active one the remaining advantage is to have a little more SPL capacities bellow 200/300hz, in very high SPL demanding apoplication it can be usefull (night club)
-
-
Try to use fluid design
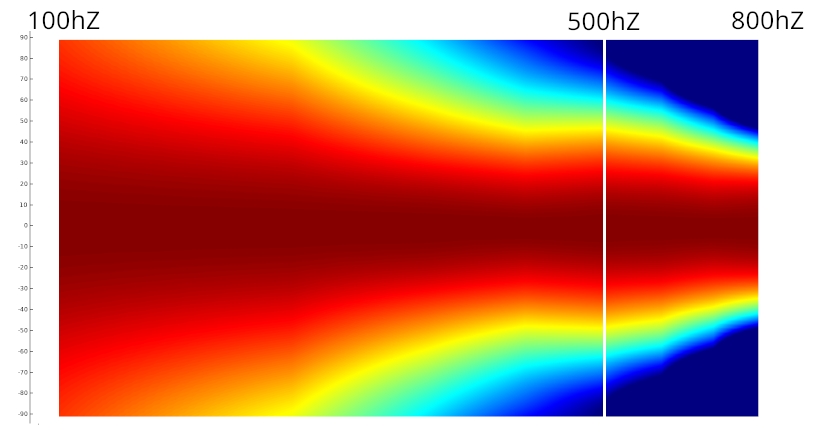
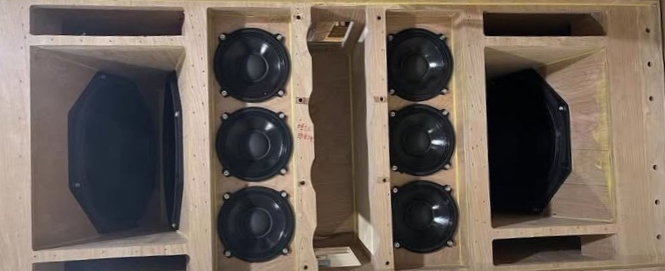
Another solution is to narrow each “M” of the MTM to reduce the vertical lob impact.
It can be done by replacing each “M” by 4 drivers forming a compact square, the number of drivers in this solution is puch to 8 by speaker, 4 at the top of the HF section and 4 at the bottom.
The vertical polar will be :
We will see in next chapiter that this kind of quadro arrangement can also be used outside of MTM strategy.
Alternatives to MTM:
It’s important to consider the context when choosing a speaker configuration.
-
Subwoofer Integration: If you’re using a subwoofer, the benefits of dual woofers or MTM become less significant, even in 2.5 voices.
-
Long-Range Listening with high SPL usage: For long-distance listening with high sound pressure levels (SPL), a 3-way speaker system might be more suitable, with or without subwoofer.
TMM
Older conceptions utilized a wide horn, approaching 60cm in width, with two 15" woofer horzontally placed such as the TAD TSM 1:
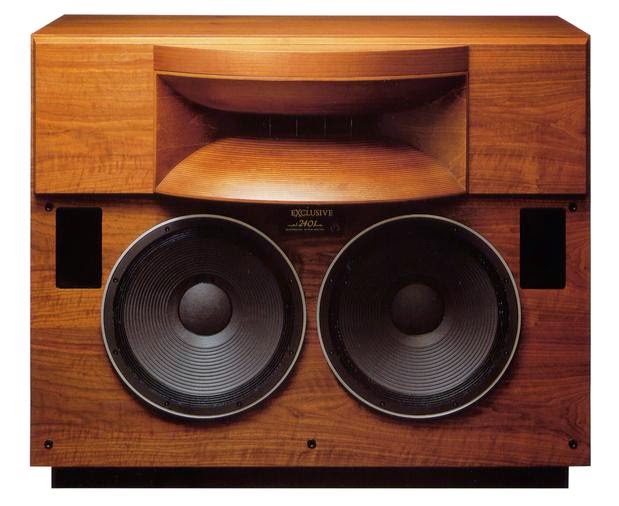
In this configuration, achieving directivity matching could only be accomplished with dual 15" woofers placed side-by-side. Theoretically, this arrangement, with the 15" drivers positioned as closely as possible, would leverage horizontal lobes to create a more restricted directivity pattern.
Finite Element Analysis (FEA) simulations were employed to model real woofers within this arrangement.
While these simulations yielded results, the narrowing of the directivity pattern was excessive, as the 15" drivers centers remained relatively far apart:
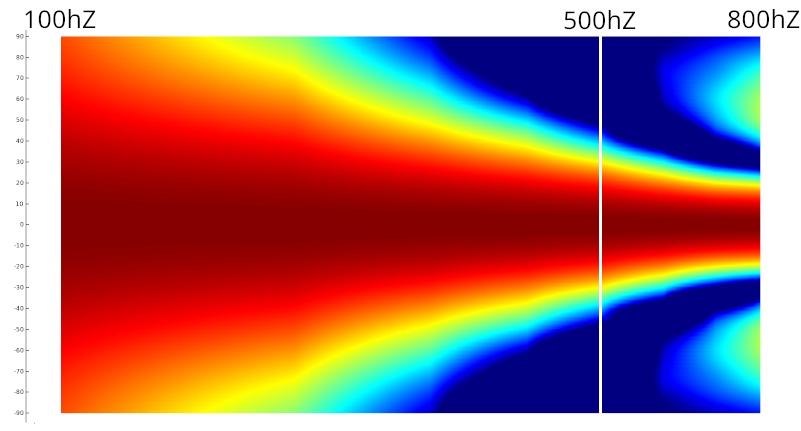
If an internal radius is introduced to bring the woofers closer together by “pinching” the box from the inside:
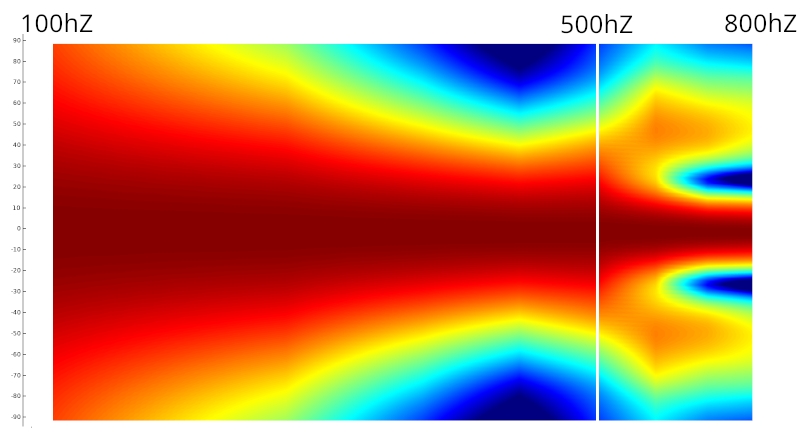
Alternatively, an external radius can be employed to bring the woofers closer by “pinching” the box from the outside:
While this approach introduces some “blurring” of energy due to the driver orientation, the resulting directivity pattern is still excessively narrow. Since the “pinching” is external, the negative throat effect observed with the internal pinch is no longer present.
This system can function, but it necessitates a large horn with a 1m mouth and an 80° flare angle cut off at 400Hz, or a 70° flare angle cut off at 450Hz.
Modern coaxial compression drivers can reach 400/450Hz, but not at high output levels, as the voice coil would overheat. This type of arrangement appears more promising with 12" or 10" woofers, allowing for closer driver spacing.
Further simulations demonstrate that with a 1.4" driver crossed over around 600Hz to a 60/65cm 90/80° horn, the dual 10" configuration appears to be the most suitable:
We have to keep in mind that a change is the center to center spacing beetween both woofers have a huge impact on the polar response, it should be simulate in FEA before.
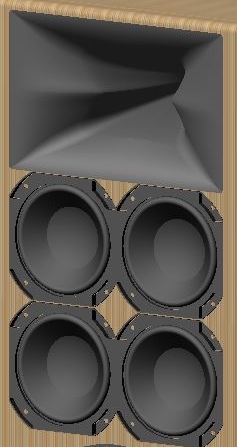
The solution can be to push to restrict vertical directivity in this way, using a “quadro” configuration:
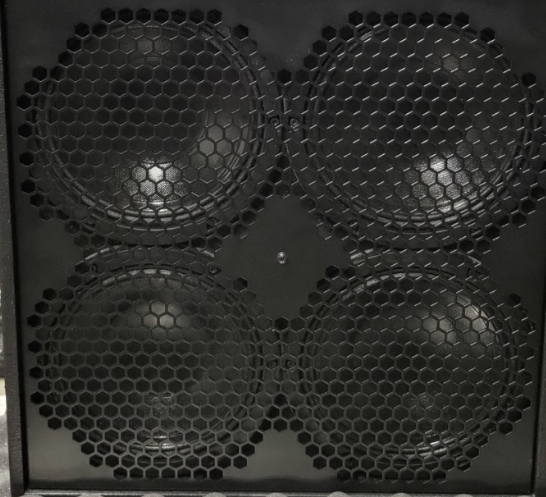
This solution is useful for creating a radiation surface between one 15" woofer and two horizontal woofers.
We have simulated this arrangement with four Faital 5FE120, which fit well with the X-Shape X25 or X28 in a TMM/MM arrangement. MMTMM must not be used, similarly, an 7/7.5-inch quadro in a TMM/MM configuration below an X-Shape X40 at a crossover frequency of 700-750 Hz is interesting.
It’s important to note:
-
The improvement due to the lobes will be mainly present if the driver size and position are carefully chosen to match the horn directivity
-
The effect mainly applies around the crossover in comparaison to a regular well implemented TM arrangement, see next chapter why.
-
Lobes created by multiple drivers (MM or MM/MM) suppress the impact of mid range narrowing through their own cancellation.
-
When the enclosure width is significantly larger, using two 15" woofers will result in an excessively narrow radiation pattern, even with slight adjustments, it’s an old design that show some limits.
-
MTM can be used in “quadro” woofer arrangement (MMTMM) but the generated vertical directivity will make a good vertical directivty match impossible, it’s not recommended but to fix it we can use a doble quadro configuration
Lobs in Line array
LOBs can often be used in line array units to control radiation on both axes to respect the WST criteria:
This approach is specifically designed for large line arrays. Tiny line arrays cannot effectively cross low with subwoofer lines. The height of the line array directly influences the lowest frequency at which it produces plane wave radiation, with taller arrays achieving lower frequencies control.
However, line arrays require significant space in environments. To effectively control radiation at 80Hz, a line array might need to be 5 meters long and positioned far from any surfaces or obstacles, even ground. This is crucial because the cylindrical wavefront produced by the line array must remain unobstructed to maintain its integrity. Any obstruction will disrupt the wavefront and degrade the system’s performance.
Line arrays are composed sources consisting of multiple units that combine to create a single perceived system. These individual units act as single primary point sources, each radiating sound waves. The combined effect of these waves creates the final characteristic of the composed sound, particularly at a certain distance. It will take distance (aka time) for the cylindrical or even the initial plane wavefront to form.
Midrange Narrowing and directivity impact
We can easily make a simpler box, just large enough for the mid-woofer, and combine the natural directivity of the mid-woofer with its midrange narrowing to achieve a perfect directivity match with the horn at crossover region.
Consult our article on midrange narrowing effect to know more.
A point about Polar
We need to pay attention to scale in polar plot. A “half-space” option in VituixCAD displays the polar response over 180° instead of 360°. If we stay in the 360° mode, the scale is affected, and the polar response may appear more consistent than it actually is.
The same issue exists with the color scale, where using solid colors for a 2 or 3 dB range instead of a gradient can hide certain problems.
Lastly, an even simpler issue is with polar maps that start at 0 dB or use the same color for ranges like +6 dB to -2 or -3 dB (and sometimes even down to -6 dB). This completely obscures the true response of the horn.
The yellow color should also be on the -6dB and not -10dB to not hide everything in the red color.
MEH and Synergy horn
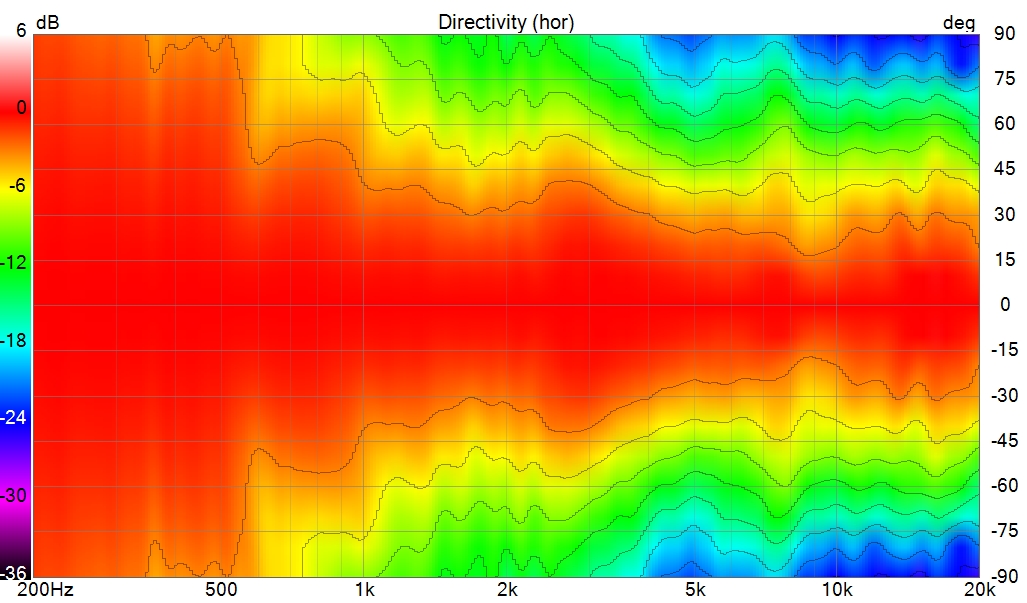
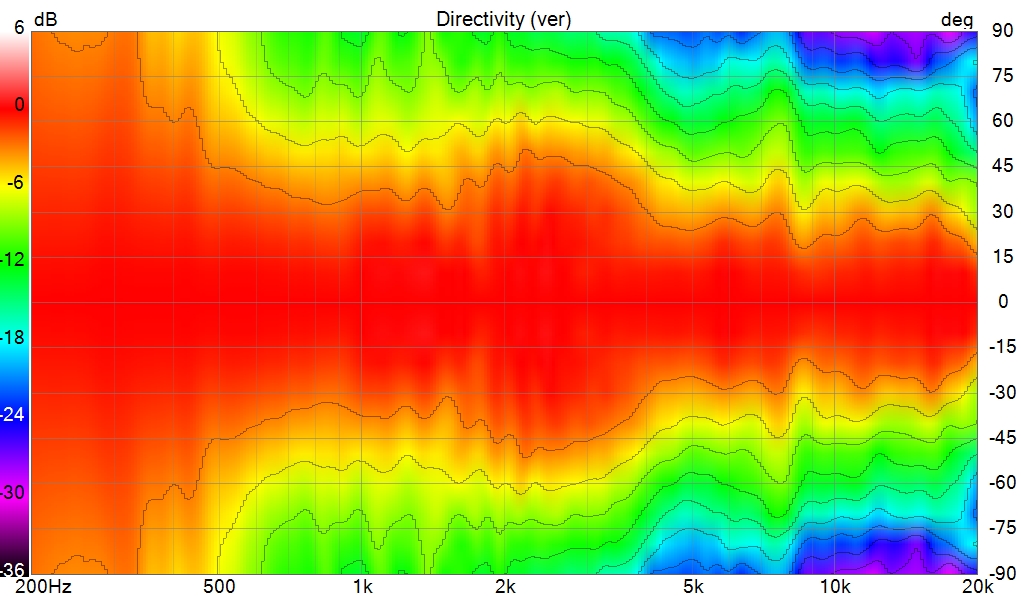
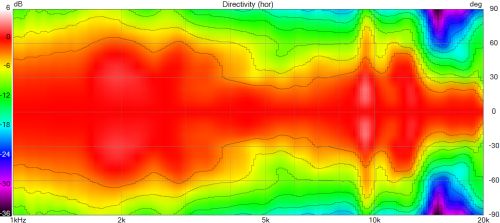
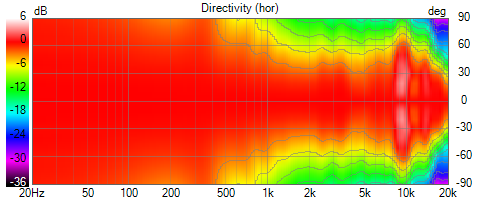
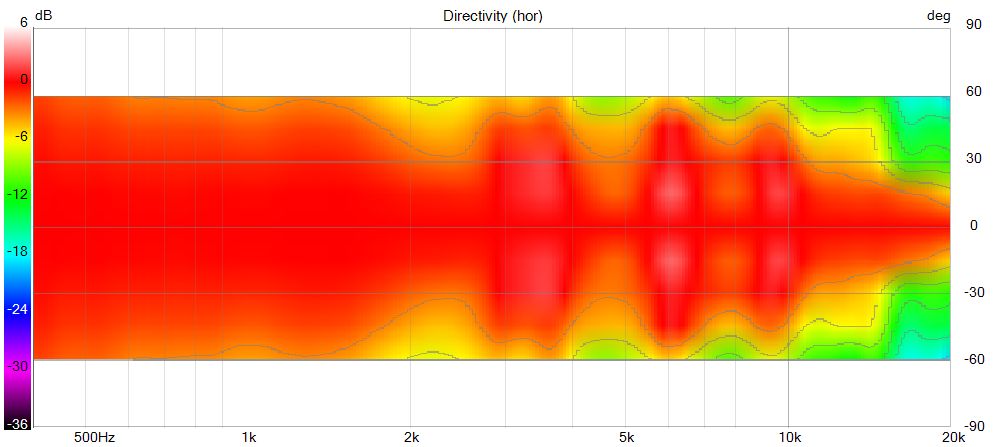
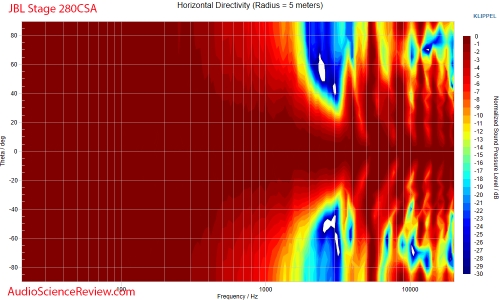
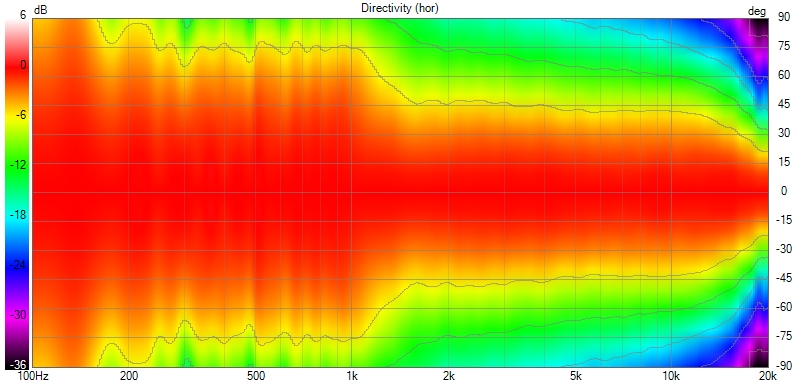
Synergy Horns are a fine solution to reduce size and make portable speakers for PA usage. However, their directivity can be quite uneven. This is not a significant issue outdoors without walls, but indoors, when we listen to a combination of direct sound and sound reflected from walls, it can result in an uneven and less than ideal listening experience.
Here are some rare and hard-to-find horizontal polar plots of three different MEHs. One of the plots was originally in 4π and has been adjusted to 2π (Half Space) to better illustrate what happens:
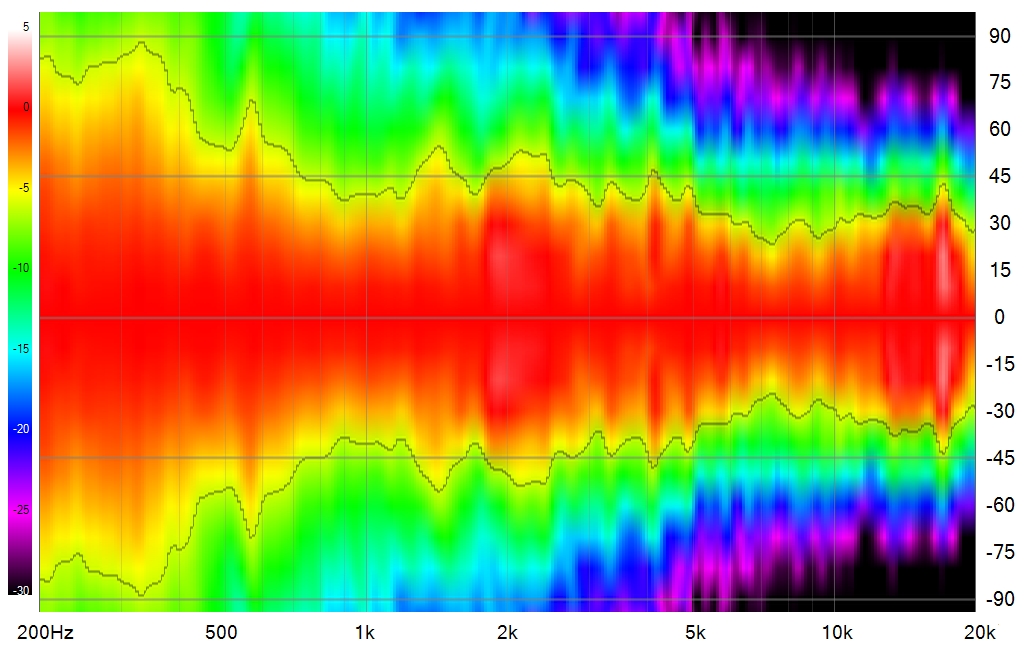
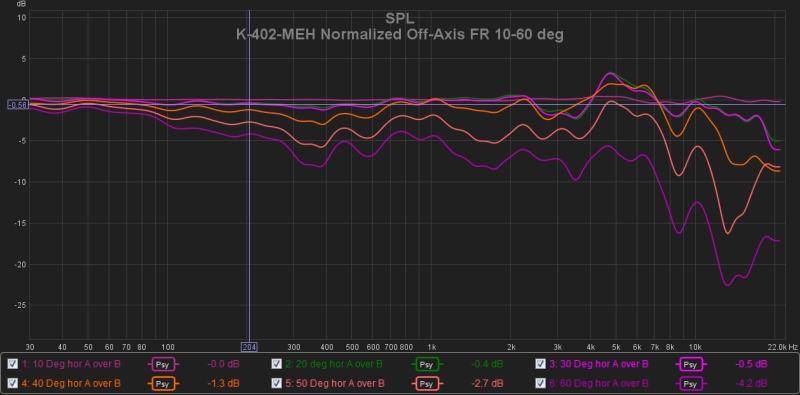
MEHs (Multi Entrance Horns) use multiple speakers positioned at different entrances along the horn to achieve “point source” and create a directivity thanks to lobes but unlike a single source, these multiple entrances generate not only interference lobes in the frequency response but also internal reflections that can alter temporal coherence. In particular, the speakers placed on the sides inject acoustic energy that can partially reflect back into the horn, creating a return wave. This phenomenon modifies the acoustic impedance perceived by the speakers, which can induce additional reactance.
In addition to this effect, several other issues may arise:
- Comb filtering and interference: The multiple entrances create destructive and constructive interferences depending on frequency and listening angle, which can affect the linearity of the frequency and phase response. That we can see on polar upper.
- Variable acoustic load: The reactance caused by internal reflections can modify the coupling between the transducers and the horn unevenly across frequencies, impacting the sound radiation efficiency.
- Excitation of resonant modes: Certain horn geometries can amplify specific frequencies due to internal reflections, creating parasitic resonances.
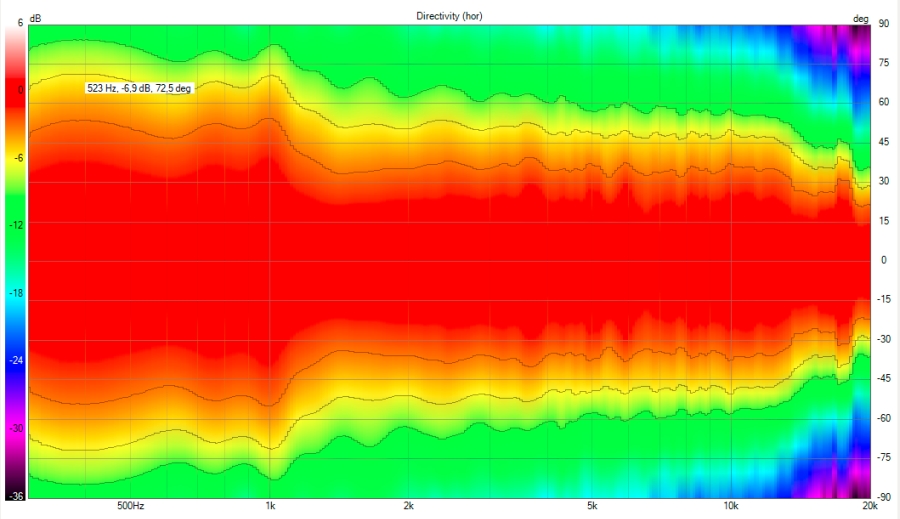
Coaxial
Here, we will examine the measurement of the KEF R3 in half-space, widely considered one of the best coaxial speakers on the market, featuring a 100% fluid profile.
The coaxial arrangement avoids lobing between sections at the crossover. However, the mid-woofer section now serves as a waveguide for the tweeter, introducing challenges in maintaining consistent directivity — especially due to the tweeter–woofer junction but also to the surround diffraction.
For DIY purpose:
Sica 6.5C1.5CP
Satori MT19CP
In pro section the B&C 10FCX64:
For in-wall section the JBL STAGE series:
Point source
The concept of a “point source” is often advanced as an advantage of MTM or MEH (Multiple-Entry Horn) speaker arrangements.
Perception of a point source is primarily due to the coherent summation of sound waves between the drivers. These aspects are highly dependent on the center-to-center spacing between each driver proportionally to the wavelength of the crossover frequency, but not only.
The listening distance plays a significant role. A system listened to at 1 meter behaves differently than listened at 6 or 30 meters: At sufficient distances, even a large line array is considered as a point source.
Any well-designed and properly crossed lower enough loudspeaker system, especially those employing horns, will exhibit point-source behavior at a certain distance relatively fast, even the bigger ones, it’s more a question of implementation.
The “problem” of not being a “true point source” is primarily relevant in niche scenarios like tiny speakers used on desktops at very close distances (50-70 cm). In such cases, a small coaxial driver can effectively address this concern. However, from an acoustic perspective, this is not a rel issue in real-world listening situations, even in a regular room.
Vertical diffraction and impact on vertical directivity:
In this article about diffraction, we can see that vertical diffraction significantly impacts vertical directivity due to the surrounding environment and the shape that the wavefront encounters, it should be taken in account too.
![]()
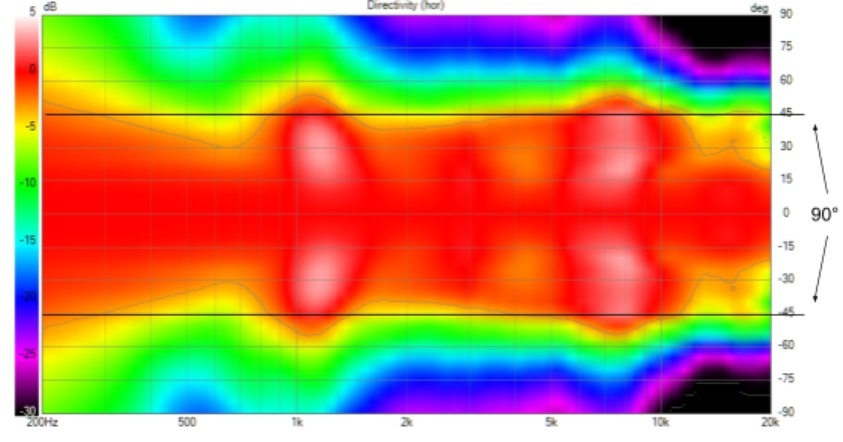
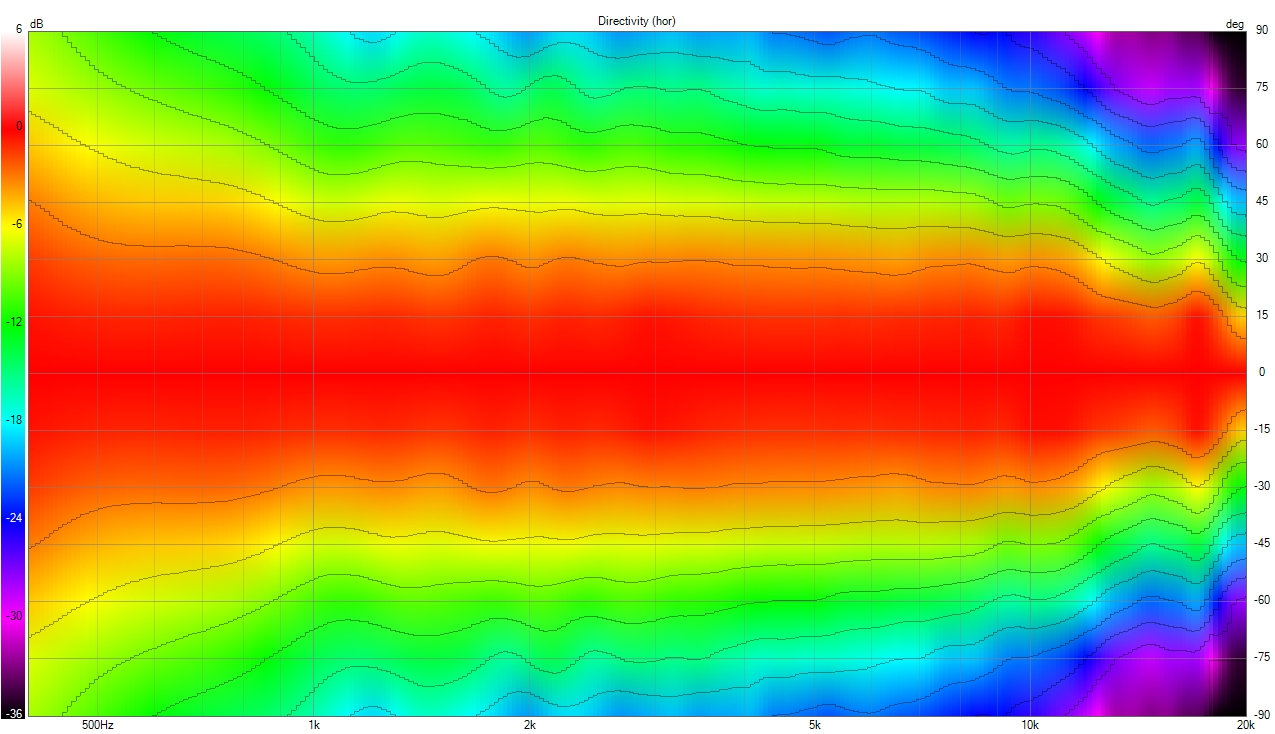
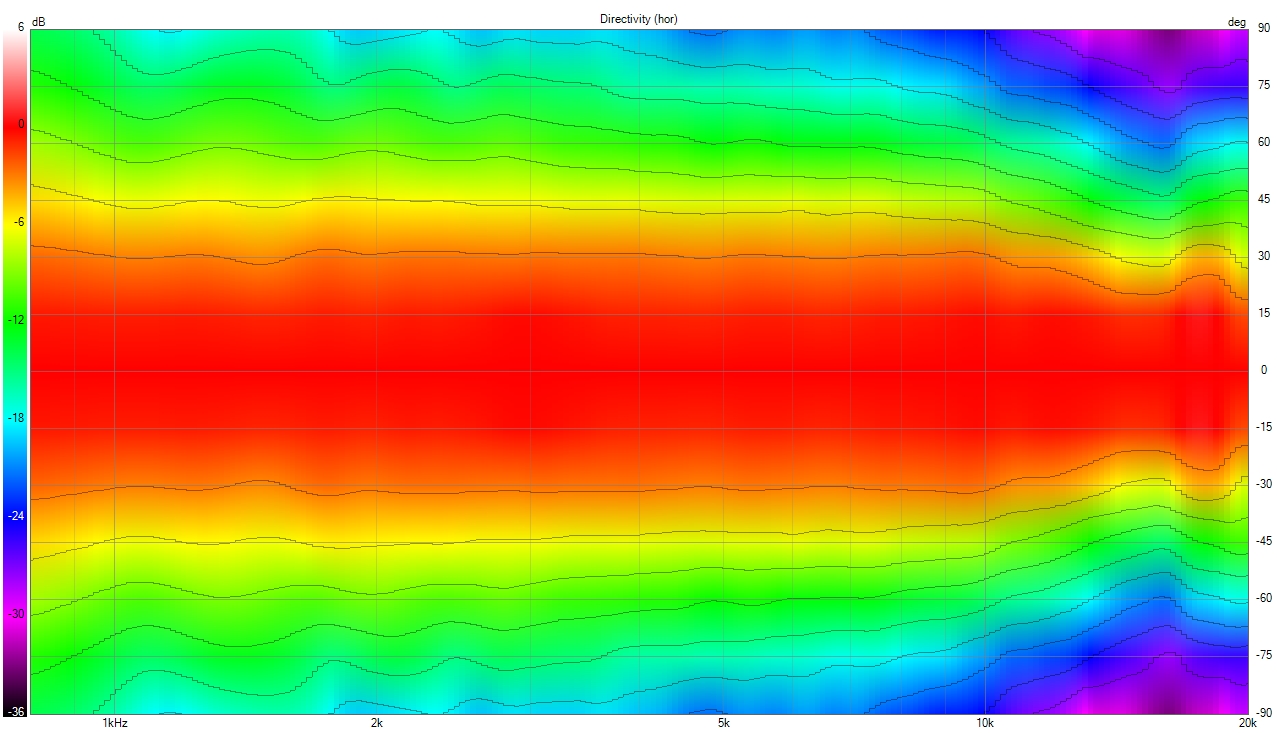
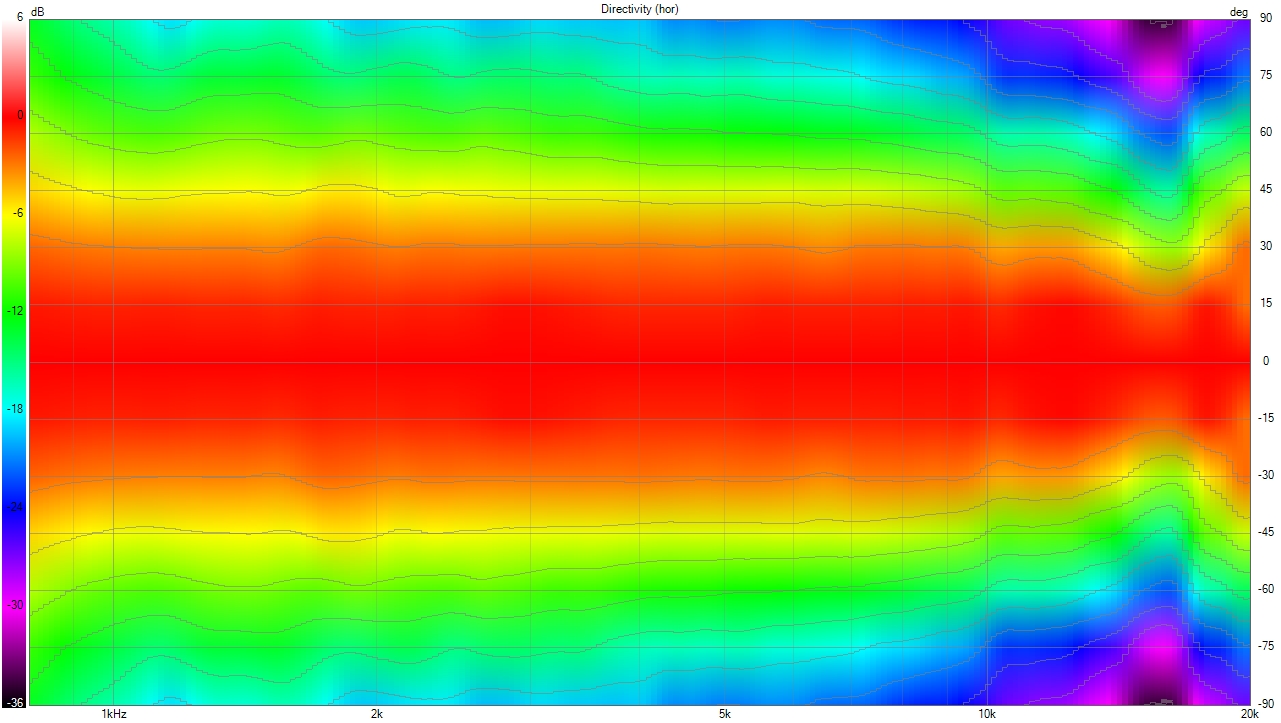
Polar map, polar plot, contour plot
Heavily used at AudioHorn, the polar map or in fact the contour plot in our case, is a graphic representation of the energy radiation provided by a device, in dB scale versus angle in degrees.
It obtained by measuring the speaker, far away from reflective surfaces including floor, every 5 or 10° on an vertical axis by turning the speaker on itself, not moving the mic, at a precise distance and with gated measurements.
The contour plot has the advantage to make all the frequencies visibles in one graph:
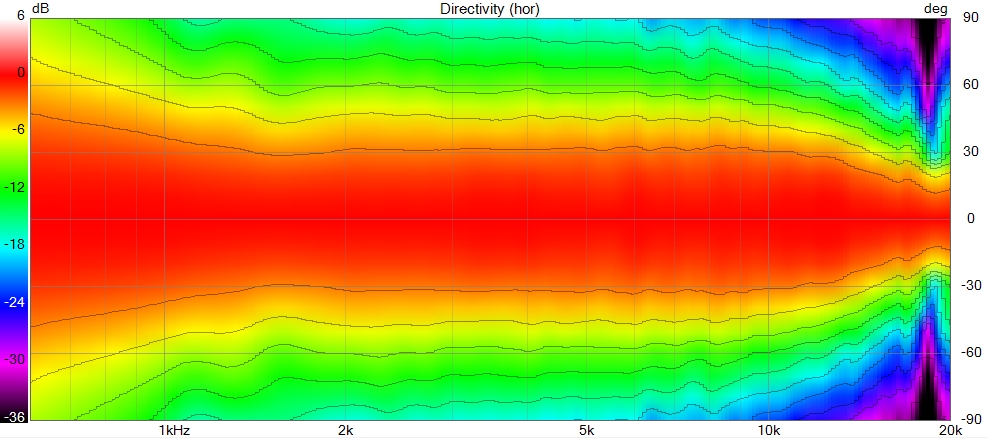
Where the -6 dB, here the transition from red to yellow by convention, defines the opening angle of the horn or waveguide. As it’s flat we can also said that the directivity is constant, we use VituixCAD for visualization here.
But turning the speaker on itself means precisely using an axis, and to define where it is?
It’s why we will talk about Apex or apparent Apex.
What is Apex ?
The apex is a point where the horn or waveguide’s profile axes virtually meet, if the profile is curved, which is systematically the case today and in our profile, it’s where the opening axes used to calculate the profile meet.
This is not the source of emission although by choice some designers have made the two coincide. It’s often not the same between horizontal and vertical, here point A is the Apex when B is considered as the baffle:
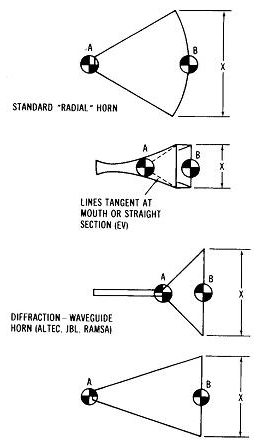
This point allows to properly characterize a “guided” transducer (waveguide and horns but also coaxial driver) to have real directivity measurement.
To measure a direct-radiating loudspeaker or one with a very short/small WG, it doesn’t matter and rotating around the baffle plane is sufficient.
In the case of polar measurement of a single element, we will place the mic at the height of the targeted element and rotate around the apparent apex.
Rotating around something other than the apex for a horn or waveguide will introduce a “distorted polar plot”: The closer we measure, the larger the mouth and deeper the apparent apex is, the more crucial this point is.
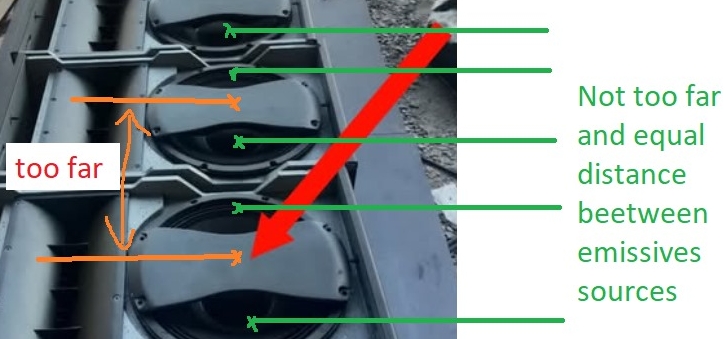
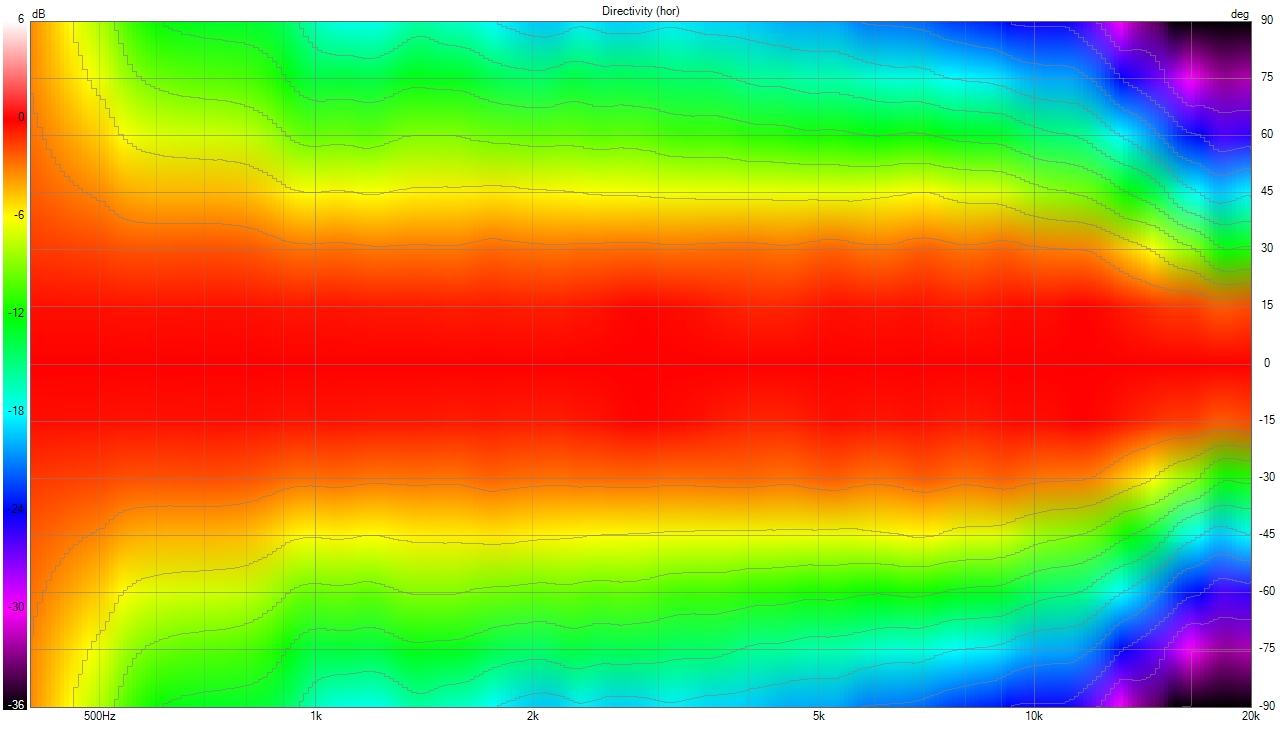
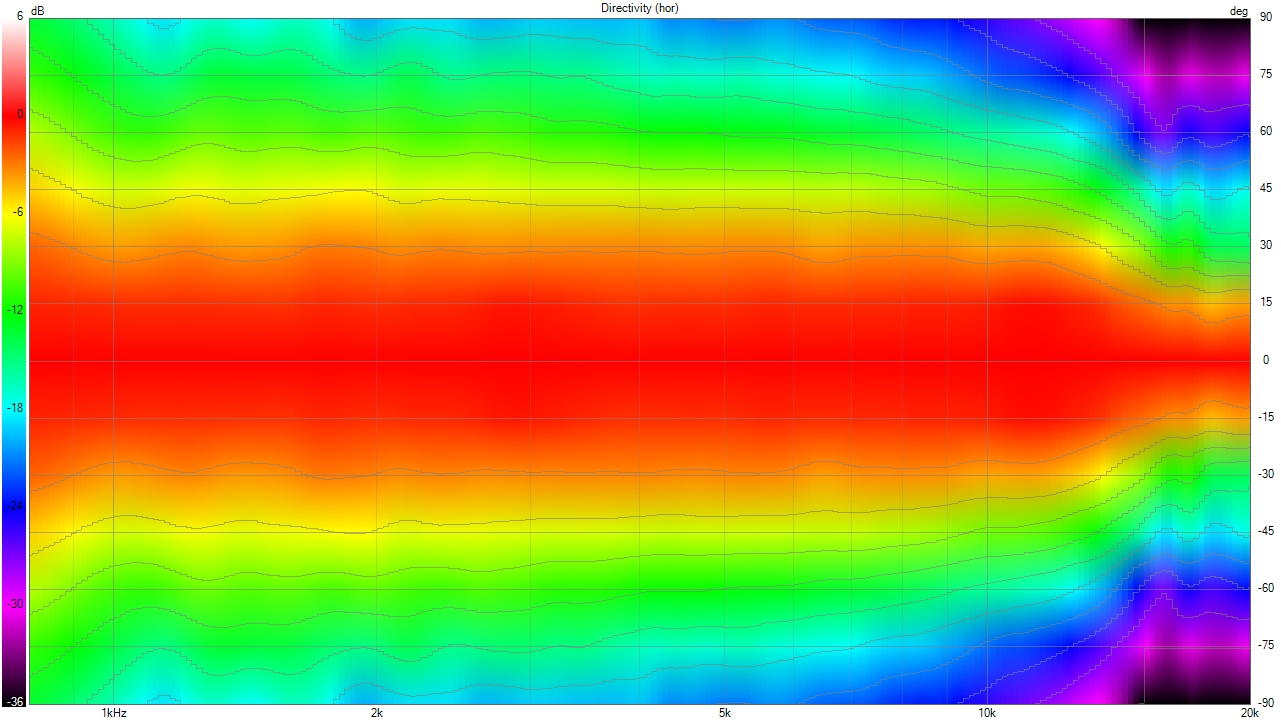
Distorted polar plot
The distorted polar plot is not a distortion in the usual sense in audio, it should be seen as a trigonometric error between the position of the microphone, the apex and the width of the horn mouth, The shape of the directivity will generally be correct but the opening given by the angle at -6dB, will be in the wrong position, sometimes to a large extent, we are talking about a difference of the order of 10°. The entire energy distribution is distorted.
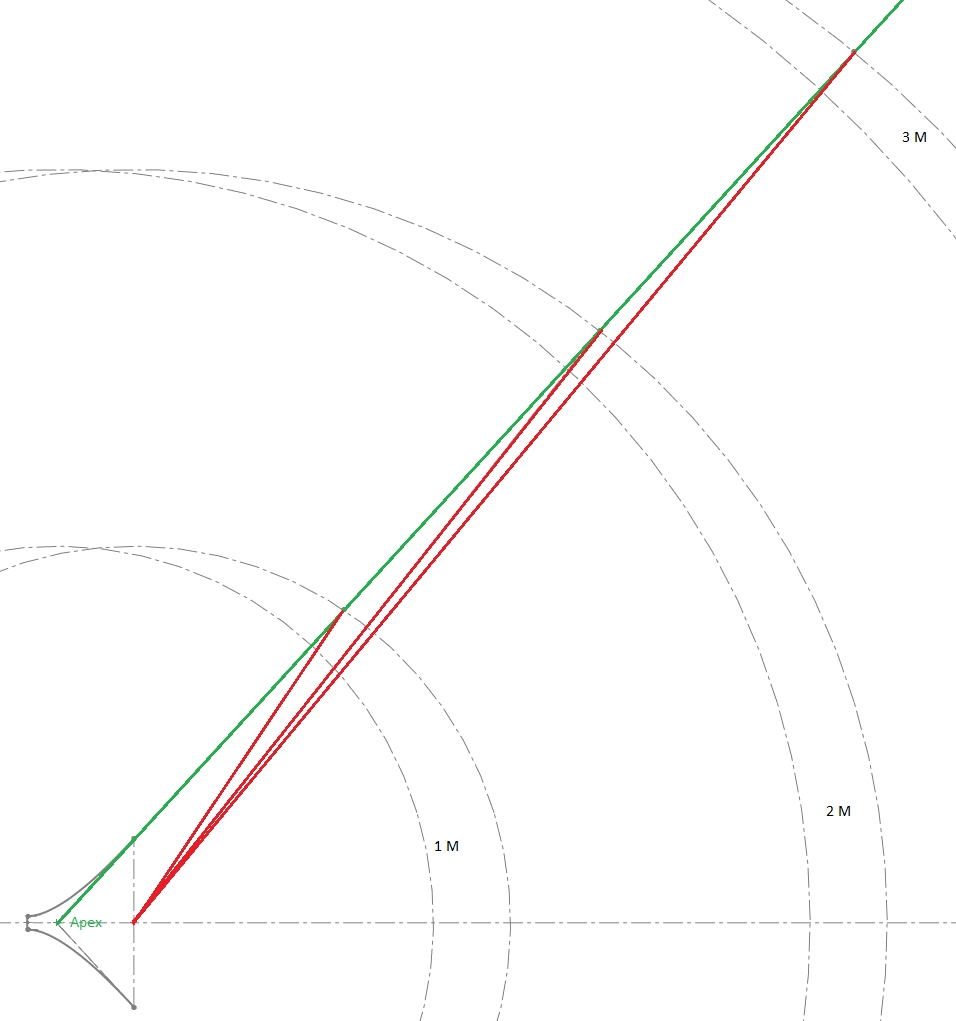
Here the green line is aligned with the opening of the horn and also shows how to find the Apex and the red lines are the equivalent by rotating around the baffle, but this is valid at any point.
Note: A horn is never measured free-air without full roundover or ISO baffle, if not a lot of midrange narrowing will appear.
We can see on this diagram that the further from the DUT (Device Under Test) we are, the smaller the difference is between rotating arround the baffle compared to rotating arround the APEX.
So in a close measurement of a large horn, the rotating axis must be close to the horn’s Apex.
Hence the fact that a complete speaker is measured in anechoic chamber around 3m, as the apex being not the same between the different elements of the speaker.
We can then ask ourselves what to do when measuring a complete speaker fairly closely when we don’t have these perfect conditions, two cases are available to us:
-
The guided part is small and does not go low so much, a point equidistant between the mid-woofer Apex and the “loaded” part, will suffice.
-
The guided part goes down (let’s say 700Hz), it covers a big part of the reverberant field, that is after the Schroeder distance, below it’s the modal field.
This is where directivity control is the most important because it will have a very audible impact in the reverberant field more than in the modal field.
In this case, we will directly choose the Apex of the top guided part.
In other words, the closer you are, the more interest there is in using the apparent apex to be in the “truth”.
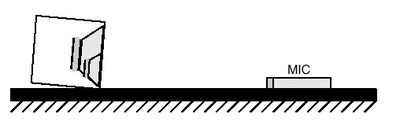
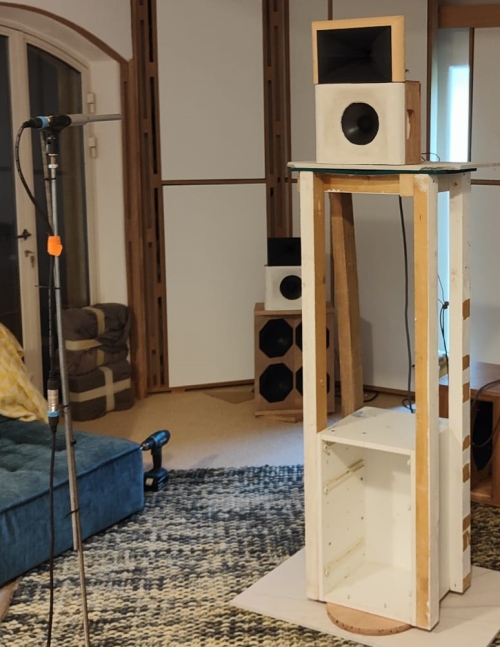
Gated measurements
Even if you measure at 1m of the Apex you will have a floor/ceiling bounce that will impact your measurement in the lower range, you can visualize it with a tool in VituixCAD to see when (in time), according to distance and height position of elements, you will have it.
The way to do is: In your measurement tool, usually REW, you have to look at the Impulse, check where the accidents due to surfaces occur in time and then gate the measurement just before the first accident as shown here:
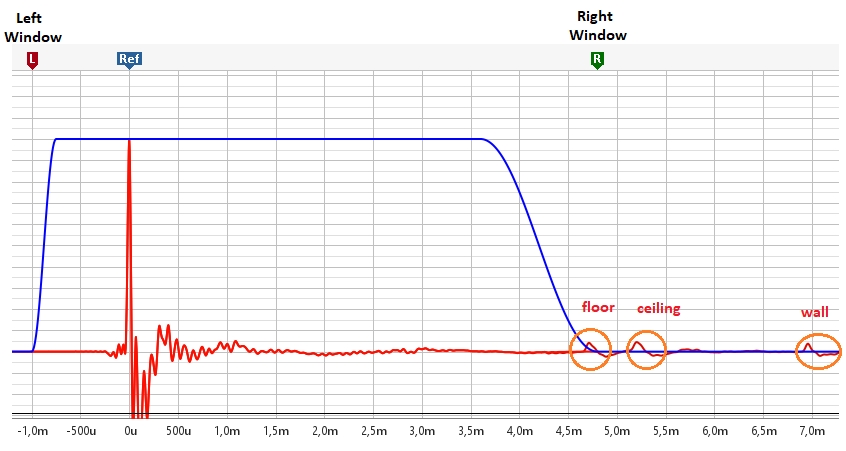
Here we put:
- Lef Winfow: 1ms
- Right Window: 4.8ms, just before floor reflection
Be also sure that Ref is on the impulse of the driver because at 75 or 90° the wall reflection can be more important in volume than the driver itself due to the fact that we turn the speaker or horn. So the measurement tool can in some cases choose the wrong Ref and put it on a reflection, so we have to move the ref to the real driver impulse, to the left.
A gated measurement avoids accounting for reflections and slightly smooths the low frequencies depending on the chosen window value, with a proportional effect as frequency decreases. For low or midrange horns, the horn must be moved further away from reflective surfaces to extend the time before reflections enter the window.
Important: When measuring and then gating a high-frequency horn, the speaker is naturally positioned at a certain height above the ground. It can be useful to place it higher so that the floor reflection arrives later in time. Positioning the device halfway between the floor and the ceiling is usually optimal.
For a woofer, avoid placing it too close to the floor. Use something to raise it as much as possible, ideally also around the midpoint between floor and ceiling. This allows for a longer gate window and therefore better frequency resolution.
A point about Scale
We need to pay attention to scale of the polar plot. A “half-space” option in VituixCAD displays the polar response over 180° instead of 360°. If we stay in the 360° mode, the scale is affected, and the polar response may appear more consistent than it actually is.
The same issue exists with the color scale, where using solid colors for a 2 or 3 dB range instead of a gradient can hide certain problems.
Lastly, an even simpler issue is with polar maps that start at 0 dB, a proper polar map should account for everything above 0 dB, rather than ignoring it.
Using the same color for ranges like +6 dB to -2 or -3 dB (and sometimes even down to -6 dB) also completely obscures the true response of the horn.
The yellow color should also be on the -6dB and not -10dB to not hide everything in the red color.
Ground plane method
Since it is not representative of real-world usage, it should not be interpreted as an absolute reference but rather as a comparative method.
It is particularly useful for consistently comparing different components designed for the same low-frequency range.
Placing the microphone on the ground eliminates ground reflections but introduces the ground effect, where the reflection from the floor creates a virtual image source below the ground plane.
At low frequencies, where the wavelength is large compared to the distance between the real and virtual sources, the two sources combine constructively, resulting in a 6 dB increase in SPL on-axis. This ground effect can be removed from the SPL measurement using a mathematical correction function, making the method reliable for low-frequency SPL and distortion measurements.
However, at higher frequencies, the shorter wavelengths lead to destructive and constructive interference patterns between the real source and its acoustic image, causing phase cancellations and artificial lobing. This makes the method unsuitable for polar measurements, as it does not accurately represent the speaker’s natural radiation pattern.
Don’t underestimate wind, natural noise, or passing vehicles in this methodology, as they can significantly impact the results.
While this method is well-suited for SPL and distortion measurements in the low-frequency range, it is not appropriate for directivity measurements (polar plot). The ground reflection creates a virtual image that interferes with the direct sound, altering the measured radiation pattern and making the results unreliable for mid and high-frequency horns.
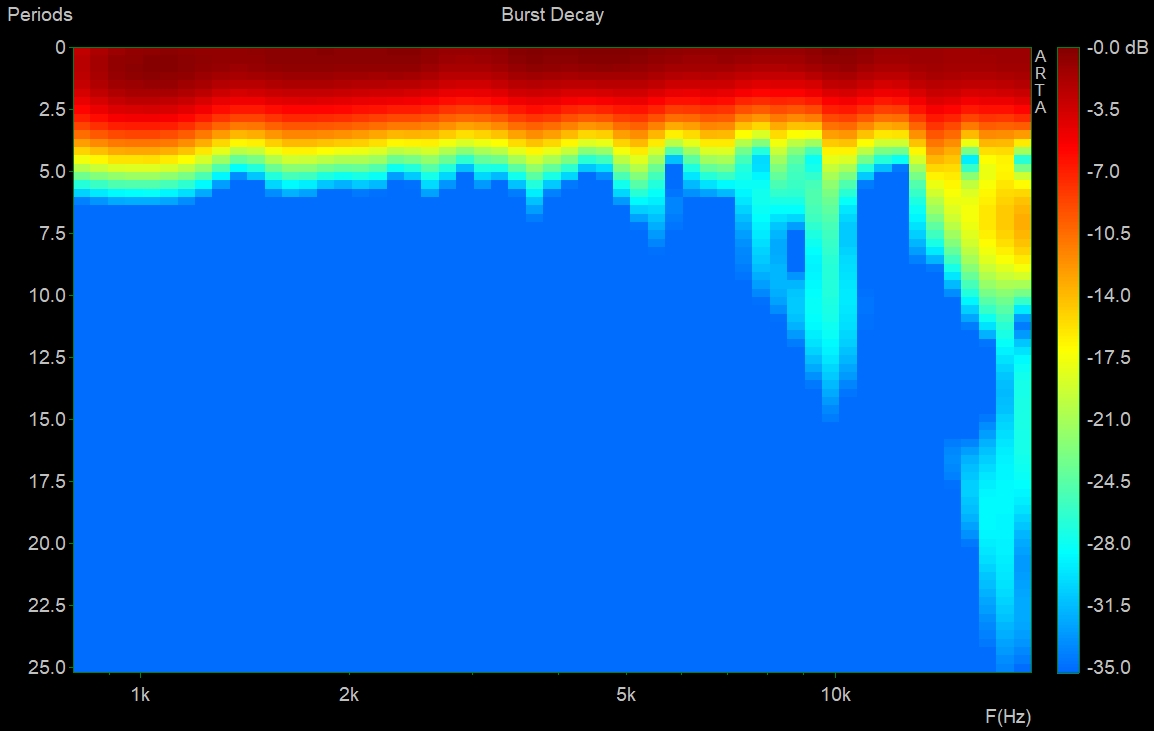
Time domain and breakup impact of polar
Even when normalized, time-domain issues have a significant impact on polar measurements. This is because when a time-domain problem occurs within the driver—due to diaphragm breakup, phase plug anomalies, or other factors—the resulting wavefront deviates from ideal plane wave radiation and no longer perfectly follows the horn profile. This leads to irregularities in the polar response.
If the breakup is well-damped or the time-domain disturbance is minor, the effect remains subtle. However, in the case of severe breakup caused by a rigid diaphragm, the impact becomes much more noticeable. Rigid diaphragms are not inherently bad; they push time-domain issues to higher frequencies compared to softer diaphragms. However, the breakup they introduce is often more abrupt, leading to distinct anomalies in the polar response.
Another point to take into consideration: the more energy (SPL) we send into the breakup region, the more visible the artifacts will be. Therefore, the higher a horn maintains constant directivity at high frequencies, the more the breakup effects will appear on the polar response.
For example:
- With a rigid diaphragm driver such as the Faital HF108R:
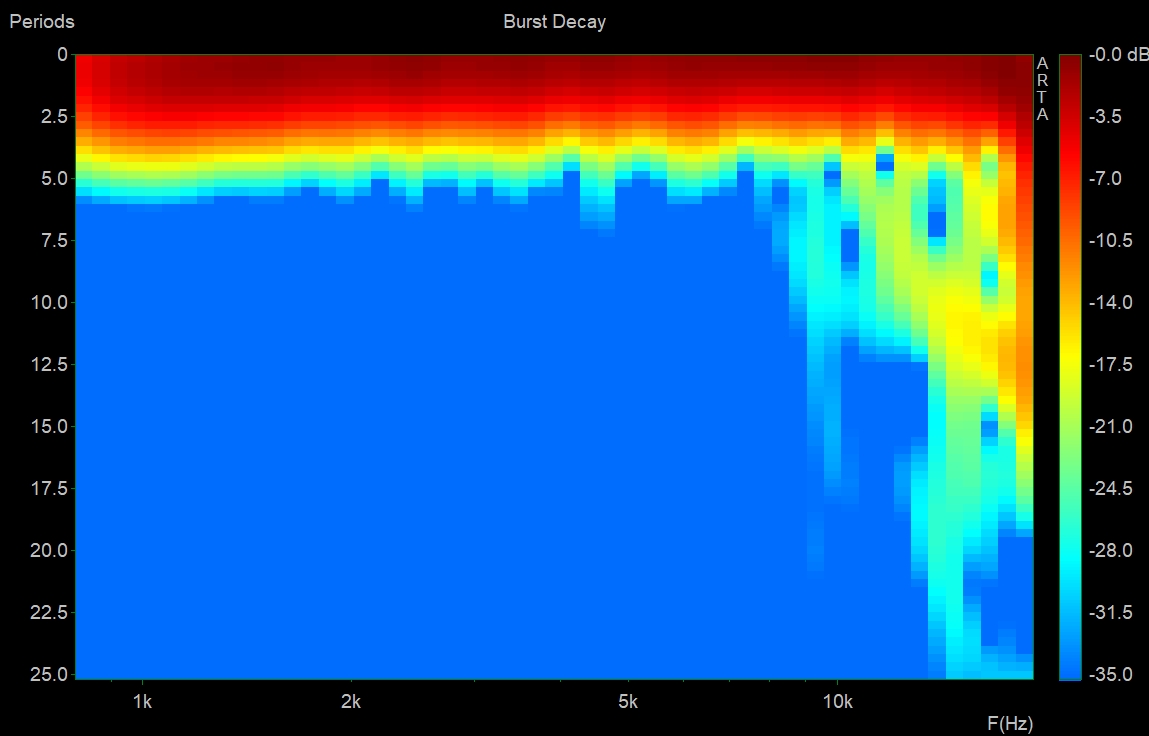
- With a very well-controlled hard diaphragm unit, the 18Sound 1095N:
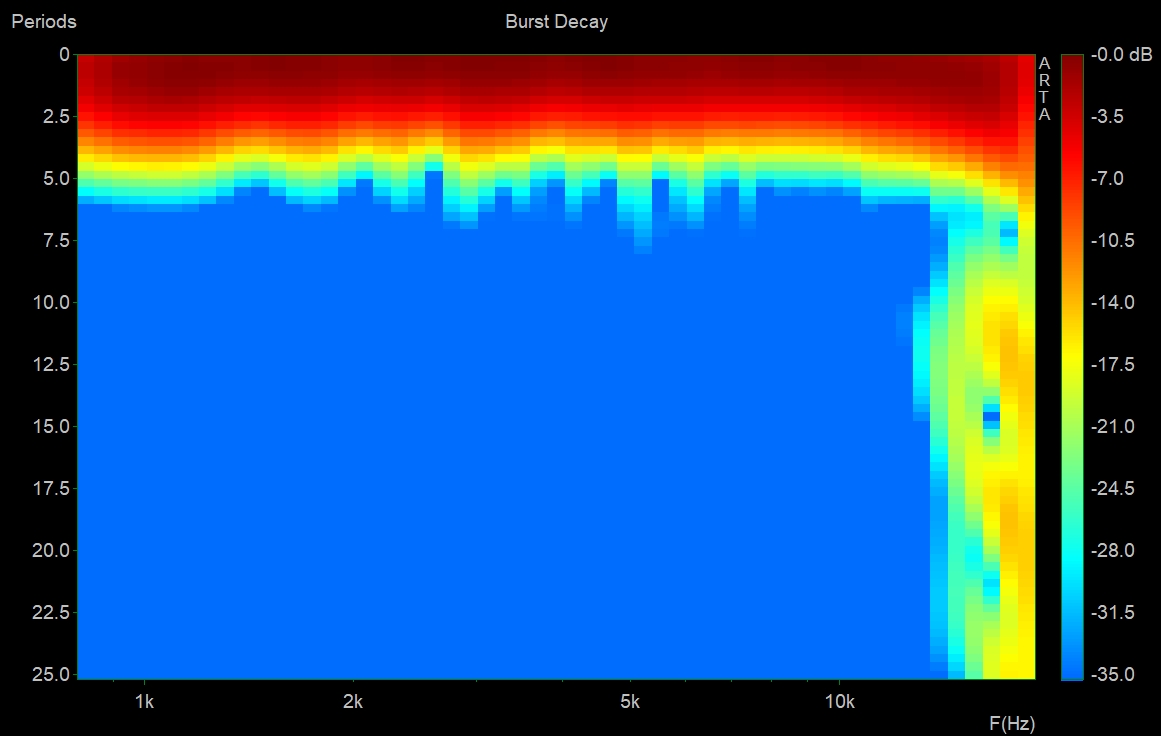
- A plastic annular diaphragm, which is less sensitive to breakup due to its shape, the BMS 5530:
We can see that even when normalized, time-domain behavior has a direct impact on polar measurements due to deviations from perfect plane wave radiation.
Time domain accidents due to the driver have a direct impact on normalized directivity.
Measurement Context
In polar measurements, it is crucial to characterize what we actually want to analyze—the horn—rather than external factors such as the environment or even diaphragm tuning.
Horn integration
A horn without a roundover should not be measured in free air. When a horn has a fluid profile, such as ours, the best approach is to use the final roundover return that will be used in the speaker, as advised on the website:
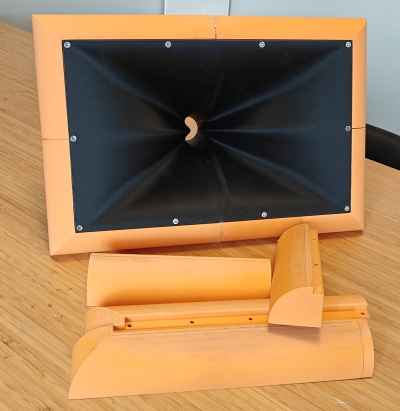
These are very important in measurement and also in the final speaker:
More information about Midrange narrowing and beaming in our dedicated article.
Diaphragm tuning impact
Diaphragm tuning is an important factor in the measurement context, as it can vary even within the same reference. In modern drivers, there are typically two measurements: one for the diaphragm and another for the compression driver.
By subtracting these values and adding adjustment rings of 0.05, 0.1, or 0.2 mm, we can set the proper diaphragm height:
Below are two measurements of the same compression driver, with normalized polar plots—first with factory tuning and then after retuning by AudioHorn:
Of course, a horn cannot correct driver anomalies, and they will be noticeable on the polar map, even if it is normalized.
Phase Plug can also be at the origin of directivity or/and temporal accident, both often linked.
Room Impact
Except in large anechoic chambers with treated ground and walls, most measurement environments, even with significant quantities of melamine, will have reflective surfaces that introduce irregularities. This can be seen in the impulse response below:
This is why most measurements are gated. It’s also important to note that our brain dynamically gates measurements, which is what we refer to as ITDG (Impulse Time Delay Gap) or integration time. ITDG is considered to be approximately one cycle (Time = 1/Hz), meaning it varies with frequency.
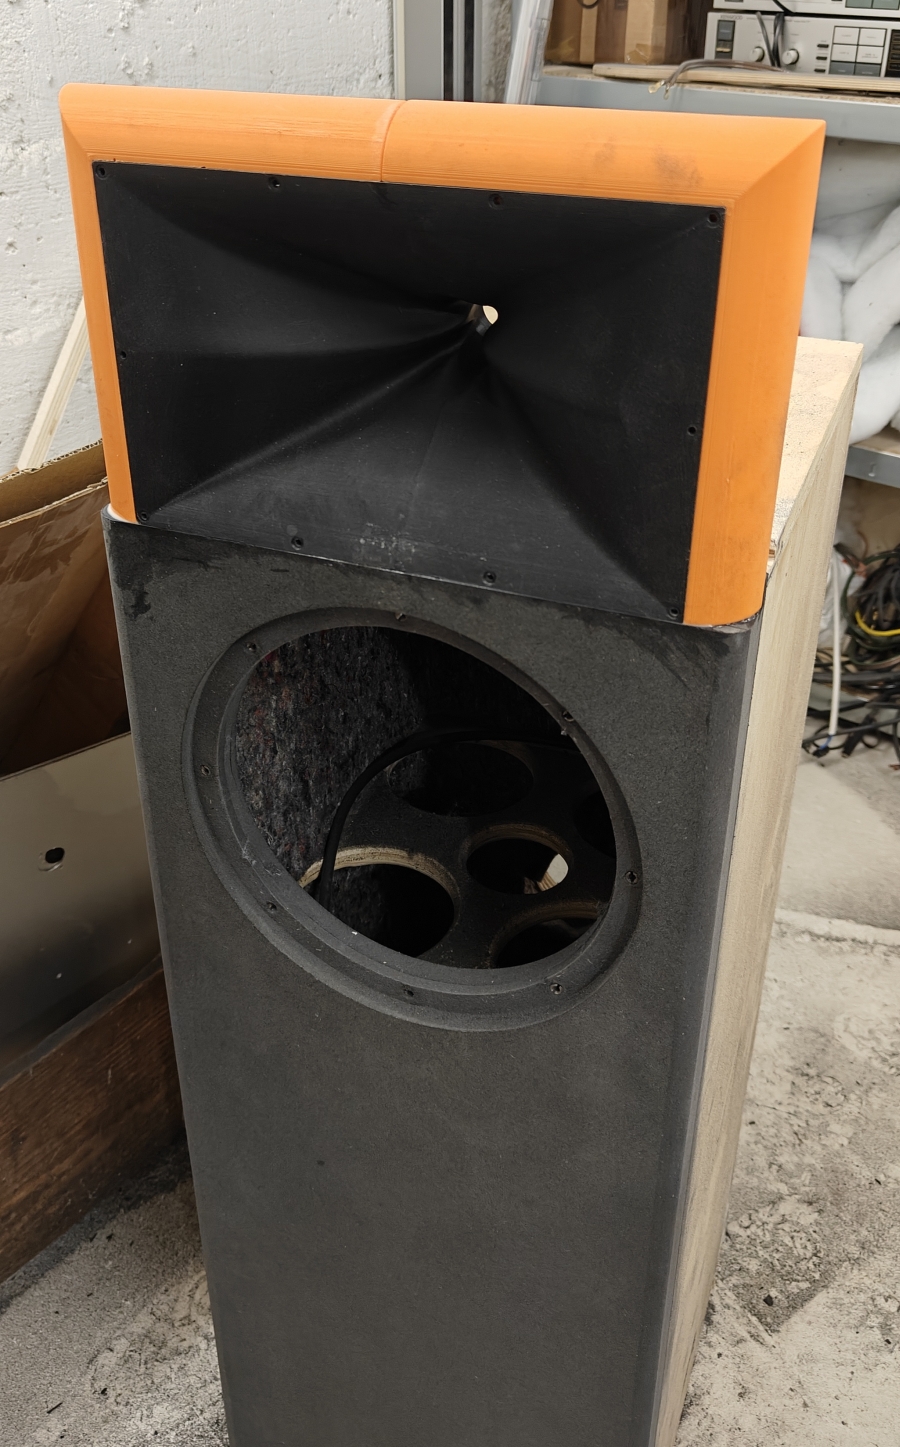
Woofer physical presence
Whether playing or not, the physical presence of the woofer beneath the horn will impact the horizontal polar pattern. However, the larger the speaker, the less noticeable this impact becomes as the components are further apart.
Mode detail in our diffraction and standing waves article.
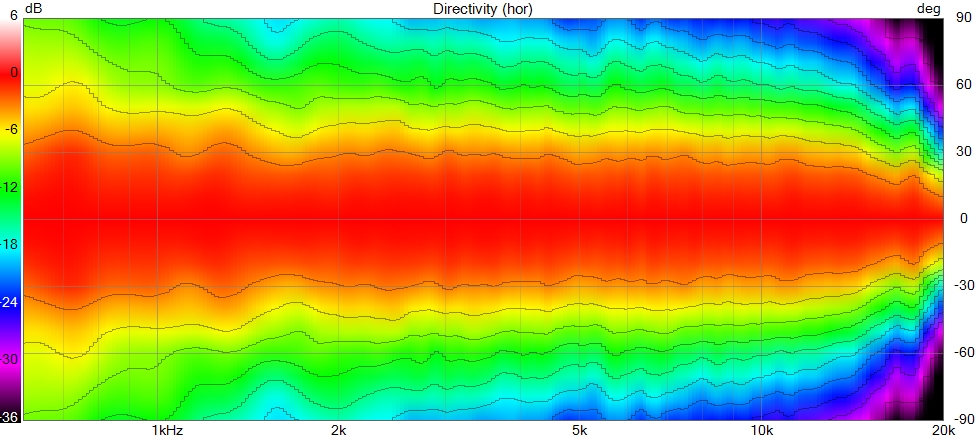
Measurement of first version X25 by clients
Below is an example of several measurements of the X25 old version, the new one is a little bit more straight after 4/5khz :
Client 1:
Conditions:
- Inside horn at 2 meters from floor and ceiling
- crossed with a mid-woofer at 1300hz
- Measuring distance: 2 meters
- Round over used: Yes
- Degree definition: 10°
- Smoothing: 1/12
- Gated: Yes
- Driver: BMS 4550
- APEX respect as turning centering point: Yes
- physical presence of woofer: Yes, realistic but alter the horn horizontal polar
Client 2:
Conditions:
- Inside horn at 2 meters from floor and ceiling
- crossed with a mid-woofer at 1300hz
- Measuring distance: 1 meter
- Round over used: Yes
- Degree definition: 15°
- Smoothing: none
- Gated: Yes 7ms
- Driver: BMS 5530
- APEX respect as turning centering point: No, so directivity distotion is on the graph as see upper
- physical presence of woofer: Yes, realistic but alter the horn horizontal polar
Client 3:
Conditions:
- Inside horn at 1 meters from floor
- crossed with a mid-woofer at 1250hz
- Measuring distance: 1 meters
- Round over used: Yes (final speaker)
- Degree definition: 15°
- Smoothing: 1/24
- Gated: Yes 5ms (ground reflection)
- Driver: BMS 5530
- APEX respect as turning centering point: Yes
- physical presence of woofer: Yes, realistic but alter the horn horizontal polar
Conclusion
In conclusion, the measurement methodology is crucial for obtaining accurate and reliable data. However, it is essential to avoid measuring the environment or the measurement setup itself instead of the actual object of analysis—the horn or waveguide. Interpreting the results is key, as we must keep in mind that certain phenomena, such as artifacts from compression drivers, are inevitable and cannot be corrected by the horn.
The compression driver has a direct impact on the results—phase and frequency response anomalies, breakup modes, temporal behavior, and phase plug effects—all of which leave a clear imprint on the polar plots. These effects cannot be eliminated through simple normalization or adjustments to the horn. Therefore, it is essential to account for these imperfections when interpreting the data, rather than attributing them solely to measurement errors or to the horn itself.
A solid methodology ensures that the measurements reflect the system’s actual behavior, not artifacts introduced by the environment or the measurement technique. By following rigorous practices and staying mindful of the specific characteristics of each component, we can obtain useful data for ongoing optimization and better control of directivity—while maintaining a realistic view of the system’s performance.
Sources
- Mark S Ureda - Apparent Apex Theory, 61st convention of the audio engineering society - November 1978
- Mark S Ureda - Apparent Apex, 102st convention of the audio engineering society - March 1997
- High-Quality Horn Loudspeaker System - Kolbrek - Dunker - end of 2019
- Altec - Mark S.Ureda & Ted Uzzle Technical Letter N°262
- Quadratic Throat Waveguide by Charles E Hughes
A message from Kolbrek about HornResp about directivity:
I believe Hornresp uses a Far-field approximation model for directivity, i.e. that the directivity pattern is calculated as it would appear if you measured it at a very large distance, but the level is scaled back to a 1m distance. Otherwise, you would have to specify a measurement distance and point of rotation, and there would be a large variation in the pattern depending on those values.
If the measurement point is very far away, these variations become insignificant, and the actual rotation point does not matter.
What is “very far away” depends on the size of the source (horn mouth) and also on the “apparent apex” or center of curvature of the far field wave front.
In addition, there are near-field effects. These typically happen when the distance is shorter than (Source area)/(wavelength), this distance is called the Rayleigh distance. At larger distances, the pressure varies as 1/distance, but closer to the source the variations do not follow this law, and have peaks and dips you wouldn’t see at a greater distance.
These effects are usually not a problem when measuring small devices like direct radiators and small horns, but most horns are large enough that they become noticeable, especially at the standard distance of 1m.
When measuring horns, it is usually recommended to rotate them around the “apparent apex”. This will avoid distortion of the directivity pattern at short distances compared to the far-field pattern.
Also note that Hornresp uses one-dimensional horn models, so the directivity models are only approximations.
![]()
Relation Between Emissive Surface and Enclosure Volume
Woofer size (diameter) plays a role, but for similar sized woofers, the enclosure volume significantly affects how deep the bass extends.
A larger enclosure typically allows a woofer to reproduce lower frequencies more efficiently.
The optimal enclosure size depends on the specific woofer’s parameters and desired response.
Here is four 15" compared in low end with the same amount of energy (2.84V):
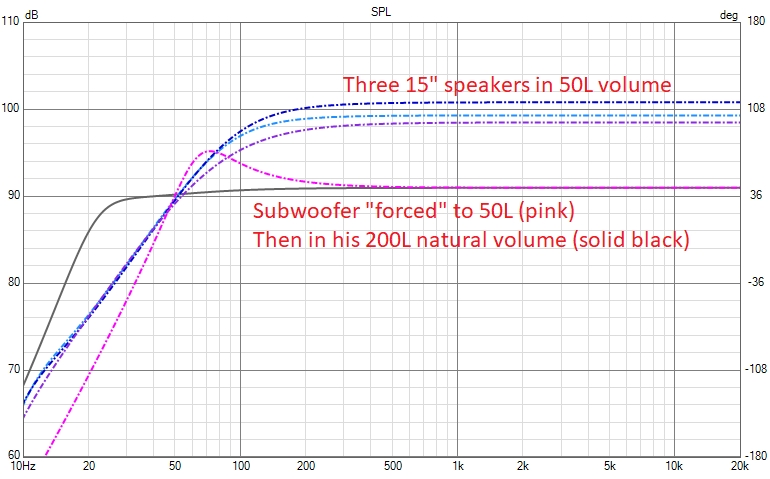
We can see the effect of sensitivity on the speaker’s output, but it doesn’t impact low-end response below 50hz for the same amount of power amplification if the box volume is the same (all drivers have the same diameter).
We prefer to say, in this case when volume and driver size are the same, that some drivers have a “flatter” response in low end than others, rather than talking about bass extension — because below 50 Hz, the bass extension is actually the same for all of them.
When we use the recommended enclosure volume of 200L for this subwoofer, we see that we gain significant SPL in the very low end.
Woofer & Subwoofer Characteristics
Sensitivity indicates how loud a woofer gets with a given amount of voltage. A higher sensitivity woofer will produce more SPL at lower amplifier levels. However, sensitivity doesn’t directly translate to how much low-end a woofer can handle.
Low-frequency distortion is primarily linked to cone movement (extrusion) — the more the emitting surface moves, the more distortion we get. Sensitivity or EQ only change the amount of energy needed to reach that movement. This gives a clear advantage to larger woofers or subwoofers in terms of distortion at a given SPL.
Even if we equalize a high-sensitivity woofer to match the low-end response of a lower-sensitivity one in the same box volume, there is likely no significant difference in distortion, assuming the drivers share the same size and load (enclosure volume). Below 50 Hz, the SPL will be roughly similar for the same input voltage.
In this context, it’s not a problem to increase the low-end slightly with EQ on high-sensitivity woofers to achieve a flatter response, since the distortion remains primarily tied to cone excursion.
Of course, using a vented enclosure instead of a sealed one allows for higher SPL by recycling the rear energy produced by the driver. This is a clear advantage, even though vented enclosures require more volume.
Vented vs Sealed
When choosing a subwoofer design, two main options come up: sealed (acoustic suspension) and vented (bass-reflex) enclosures. While both have their place, some persistent myths and misunderstandings deserve to be cleared up — especially now that modern DSP and room measurements make deeper integration possible.
Bass Extension: Vented Wins
A vented subwoofer enclosure will always provide better low-frequency extension compared to a sealed one, assuming the same driver and enclosure volume. Thanks to the tuned port, vented boxes reinforce bass around the tuning frequency, offering more output at lower frequencies.
“Tight Bass” comes from proper modal control — not from the type of enclosure.
A common belief is that sealed subs produce “tighter” or “faster” bass. In reality, this tightness comes from the room’s modal response, not the enclosure type, of course the vented enclosure goes lower so require more attention to room correction with DSP. Below ~200 Hz, your room dominates the response with resonances and standing waves. If these aren’t managed — through acoustic treatment or DSP correction — the bass will sound boomy or smeared, no matter how “fast” your sealed sub is supposed to be.
Today, with affordable measurement tools and DSP, it’s possible to correct room modes precisely. This means that a well-designed vented subwoofer, placed and calibrated correctly, can sound just as tight and controlled as it should be — while going deeper and with greater efficiency than a sealed one.
The Port: Design Matters More Than You Think
Not all ports are equal. Many designs use slot (rectangular) ports, which are compact but far from optimal. Slots tend to generate higher air friction due to greater surface area contact, leading to more turbulence, chuffing, distortion and power compression.
The best-performing ports use a circular cross-section, which minimizes wall contact and supports smoother airflow. Among circular ports, the geometry of the flares is critical. For example, the hourglass port design featured a flat velocity port , delivers a flatter velocity profile minimizing noise, distortion and compression even at high SPLs. It’s one of the best examples of how careful port shaping can outperform conventional designs.
Final Thoughts
In the age of DSP and accurate measurement, the sealed vs vented debate shouldn’t be about subjective impressions anymore. A well-engineered vented subwoofer, with a proper port and correct room integration, can offer deeper, cleaner, and equally “tight” bass.
The key lies in system design, not dogma:
- Know your room and measure it in modal field
- Measure and correct modal behavior as desrcibed in this article
- Use braces and stuffing optimized enclosures and ports
Good bass isn’t about sealed or vented. It’s about control, design, and integration.
Another Myth: Heavy Cones Are “Slow”
It is often believed that lighter woofer cones produce “faster” bass, while heavier cones sound slower. In reality, a loudspeaker has no inherent “speed” — it faithfully reproduces the input signal. If it were truly “faster,” it would alter the frequency or timing of the signal, which constitutes distortion.
A heavier cone primarily lowers the system’s resonant frequency, enabling deeper bass extension, but this comes at the expense of reduced sensitivity because more energy is required to move the increased mass. Conversely, lighter cones typically have higher sensitivity and lower moving mass, which allows them to generally reproduce higher frequencies with less mechanical stress and distortion, but they cannot achieve the same deep bass extension or control at high excursion levels as heavier cones.
Ultimately, perceived “tightness” of bass is much more influenced by proper room integration and modal control than by cone mass alone—similar to the vented versus sealed enclosure debate see upper.
Some advanced woofers cone, with an optimized balance of mass, damping, and rigidity, can be relatively heavy yet still achieve excellent high-frequency extension, better than some dedicated midrange ones, with low distortion. This is sometimes accomplished through sandwich cone constructions (like those from AudioTechnology) or/and by pairing the driver with highly advanced motors (such as PURIFI designs). Therefore, generalizations about cone weight and performance are very difficult to make.
Ultimately, precise measurements with flat EQ, and bass extension simulation remain the definitive criteria to evaluate performance.
Subwoofer Setup and Integration
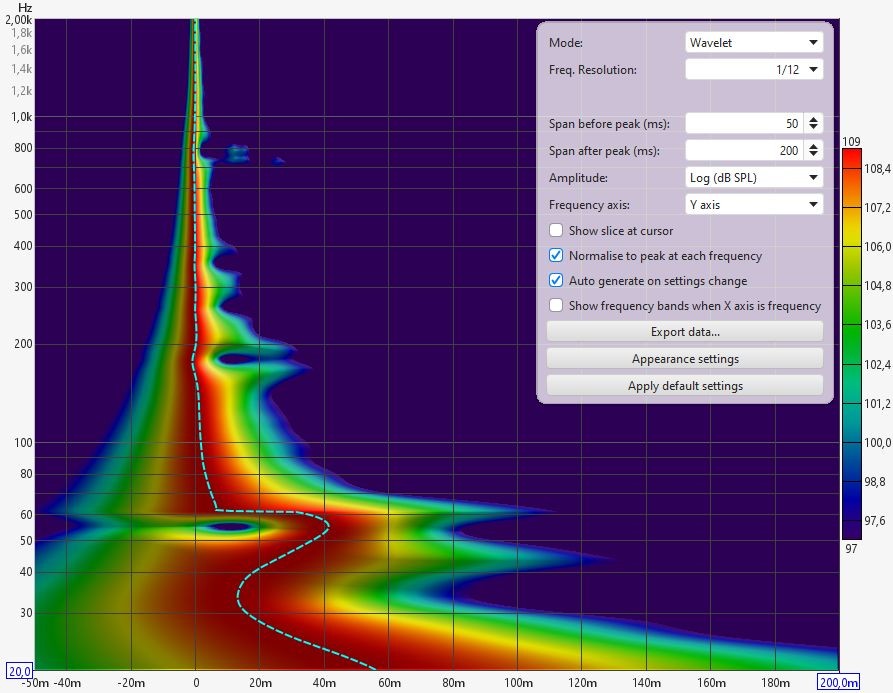
Even if we have a FIR DSP, so linear phase filtering, we don’t use it here as it will be very costly in TAPS as the frequency is lower and useless about phase at this frequency. We will search to cut between 50 and 80 hz optimally.
Measure the delay in cm and convert it to ms if the subwoofer is far, be sure to not have a reversed phase as we said for the woofer, you can check it with the same techniques.
You can correct the woofer response at the listening area by doing several measures by moving the mic in the listening area, not at just one position.
A regular EQ in minimal phase (“IIR”) placed on a modal effect with a quality coefficient (Q) equal to the modal effect will not only improve the frequency response but also the Time-domain behavior, reducing trailing bass and improving global bass experience.
Clear cancellations should not be corrected, as the nulls move in frequency depending on microphone placement:
You can add an electric (in DSP) Butt 12 on your natural woofer natural fall to have a real (acoustic) Butt 24 in minimum phase filtering, linear phase filtering is not necessary at these frequencies.
Then add Butt 24 on the subwoofer as we have do in our speaker implementation article with woofer:
Note: Acoustic treatment will not solve or significantly reduce modal acoustic issues. The affected wavelengths are very long (several meters), and standard treatments are not deep enough to be effective in this range. Modal behavior is primarily determined by the room’s dimensions, geometry, and the placement of subwoofers or other low-frequency sources — the listener or microphone position, only affects how the modal field is perceived or measured at a given point or area.
Subwoofer and Masking Effect
Be careful when you correct or “boost” your subwoofer to not introduce a masking effect. A subwoofer should continue at the same existing SPL as the woofer.
If we want more bass — and more importantly, more kick — we can increase the SPL starting from around 200 Hz, gradually, to avoid inducing masking.
Increasing the subwoofer gain alone can lead to a vicious circle: the more gain we add to a subwoofer cut at 60 or 80 Hz, the more it will mask the kick in the upper range. That’s why, when we want more impact/kick, we don’t increase the subwoofer gain alone — we increase both the subwoofer and woofer SPL with EQ starting from 200 Hz accordingly.
If you boost the subwoofer in your system, you might notice a loss of impact or “kick.” This happens because excessive sub-bass will mask the upper bass and low midrange, where the kick drum energy typically resides.
To mitigate this masking effect:
-
Use EQ to carefully balance the spectrum. Start by gradually and smoothly increasing the bass response from around 200 Hz—where the kick is located— so that the woofer rises progressively in level and typically reach +5dB.
Stop increasing a little before your subwoofer crossover, around 60–80 Hz.
Then adjust the subwoofer so it takes over with a flat response, without continuing the upward trend of the woofer. The SPL transition between woofer and subwoofer should be seamless and flat, with no noticeable bump or gap.
This approach preserves the kick’s impact while avoiding masking effects. Keep in mind that it requires more excursion from the woofer in the upper bass region.We can see this approach in psyckoacoustics principles.
-
Avoid boosting the subwoofer level independently using its power amplifier gain. The way subwoofers are typically crossed over—often with steep filters and at low frequencies—can create a sharp SPL gradient if this gain boosting is applied.
This kind of abrupt gain change can effectively mask the upper bass and midbass, where the punch and energy of the “kick” reside. A well-integrated bass should extend smoothly from the main speaker’s response—not jump in level. -
Use dynamic processing (compression) to adapt the SPL of low frequencies at low listening levels. You can also use compression or shelving in DSP to reduce high frequencies at very high SPLs, maintaining a balanced perception.
Note: In home cinema setups that use an LFE channel (which adds bass content up to 120 Hz), this technique is not recommended. The LFE track already contributes significant low-end energy. In such cases, we recommend aiming for a flat bass response at the listening position.
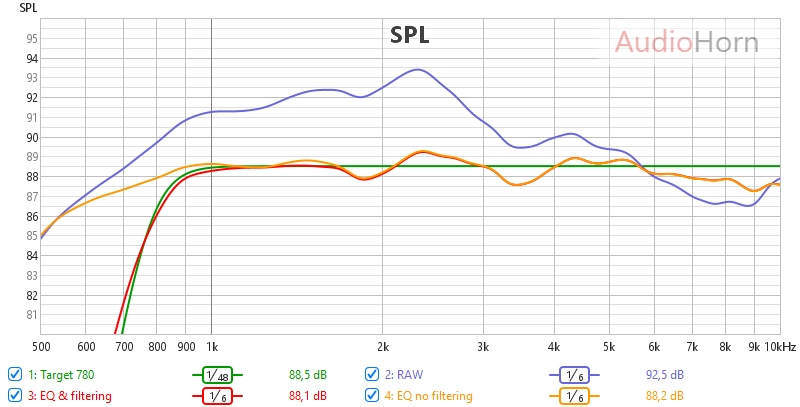
We usually create two presets: one with a flat response, considered neutral, and another with a bass increase as described above.
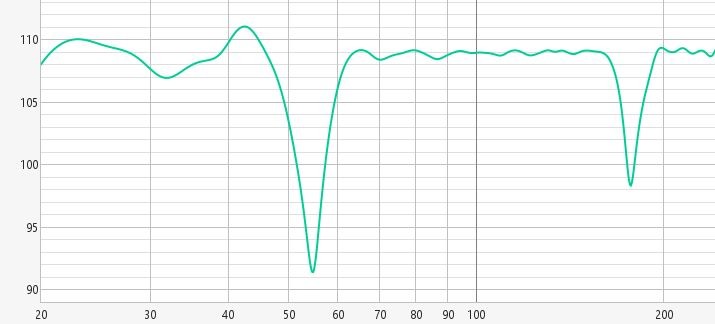
Here is a measurement showing an acceptable +5 dB transition from 150 to 100 Hz, but it could be made more progressive by extending this transition from 200 to 80 Hz.

Is Group Delay (GD) Audible in a Bass Reflex System?
It depends on the cycle length. Generally, it’s recommended that the GD should not exceed 1 or 1.5 cycles of the frequency, as this is related to its wavelength.
The formula for calculating the maximum acceptable GD is:
Δt max = n / f
Where:
- Δt max is the maximum acceptable group delay in seconds (multiply by 1000 to convert to milliseconds).
- n is the accepted cycle number (1 or 1.5)
- f is the frequency in Hertz
Example:
- For 40 Hz, Δt max = 1 / 40 = 25 ms
- For 20 Hz, Δt max = 1 / 20 = 50 ms
You can use VituixCAD Box Simulation to visualize the GD according to the box volume and port, and consider this information in your design and choices.
In practical cases, we don’t exceed the recommended GD limits if we follow standardized vent alignment so it will not be audible.
Subwoofer Positioning
Placing a subwoofer is a balancing act — we want to benefit from room gain without exciting problematic room modes. Unfortunately, the first rarely comes without the second.
A good rule of thumb is to position the subwoofer at about 20–25% of the width of the front wall, measured from each side wall. If you have multiple subwoofers, it’s best to group them in symmetrical pairs:
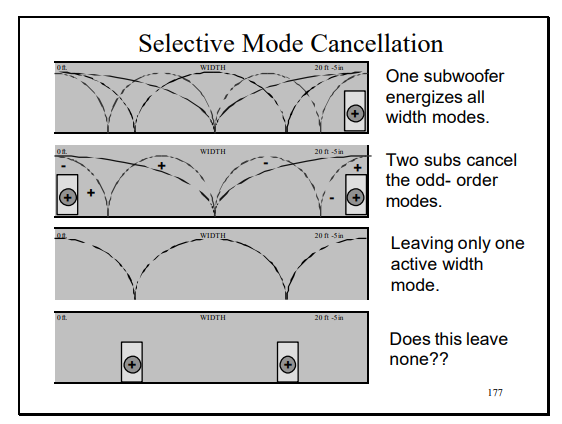
Source: Getting the Bass Right – Harman
Avoid placing subwoofers at the center of any room dimension (e.g., centered along a wall), as this can create a null in the center of the room.
Depending on your room size and desired maximum SPL, you’ll typically choose between one or two 12", 18", or 21" subwoofers:
- For maximum SPL, professional-grade subwoofers are the best choice.
- For a flatter frequency response, consider non-pro audio options such as high-end car audio subwoofers.
In most situations — except for very large rooms — a flat-responding subwoofer is what we aim for.
Below is a list of recommended subwoofers. For vented designs, look for a Qts between 0.33 and 0.36 and a low Fs (resonance frequency):
Vented:
-
Max SPL and top notch thermal compression : 18Sound 21NTLW5000
-
Pro that go low : BMS 18N862 (180L@25hz), 18Sound 18NLS4000 (100L@28hz)
-
Pro with good quality price : RCF 21X451, B&C 21SW115
-
Non pro, go low flat : Dayton RSS315HO-4 (12"), RSS390HO-4 (15") RSS460HO-4 (18") or Stereo Integrity HST-18 MkIII (only available in USA for this last one)
Sealed:
- Dayton Ultimax UM12, UM15, UM18
- All Stereo Integrity (USA only)
SBA and SBA
This particular positioning of sub is mentioned in our wavefront-propagation article
Horizontal Line Array of Subs
An alternative approach is to create a horizontal line of subwoofers along the floor, ideally integrated into the front wall. This setup spans the entire width between the side walls, with each subwoofer placed as close as possible to the next.
This configuration, while requiring many 18"/21" units, allows for plane wave radiation of the emitted bass when the wavelength of these frequencies is shorter than the length of the subwoofer array.
To ensure proper plane wave radiation, the array also needs to be digitally curved using arc delays — applying equal delay (calculated with an Array calculator) to the subwoofers at the ends of the array.
This requires using different DSP delays on the same channel, which in practice means using separate DSP output and amplifiers for each delayed group.
It’s a more advanced and expensive solution, often seen in systems like the Divatech subwoofer wall.
![]()
This article explores how a woofer’s sensitivity, maximum SPL (Sound Pressure Level), and enclosure volume impact its low-end performance.
While EQ (equalization) can be used to adjust the frequency response, achieving powerful bass often relies more on these core factors.
Relation Between Emissive Surface and Enclosure Volume
Woofer size (diameter) plays a role, but for similar sized woofers, the enclosure volume significantly affects how deep the bass extends.
A larger enclosure typically allows a woofer to reproduce lower frequencies more efficiently.
The optimal enclosure size depends on the specific woofer’s parameters and desired response.
Here is four 15" compared in low end with the same amount of energy (2.84V):
We can see the effect of sensitivity on the speaker’s output, but it doesn’t impact low-end response below 50hz for the same amount of power amplification if the box volume is the same (all drivers have the same diameter).
When we use the recommended enclosure volume of 200L for this subwoofer, we see that we gain significant SPL in the very low end.
Woofer characteristics
Sensitivity indicates how loud a woofer gets with a given amount of volt. A higher sensitivity woofer will produce more SPL at lower amplifier volt levels. However, sensitivity doesn’t directly translate to how much low-end a woofer can handle.
A woofer with a higher maximum SPL, often related to X-max, can handle more power before breaks.
However in low end regions distortion is mainly linked to extrusion, the more the emitting surface moves the more distortion we will have. Sensitivity or even EQ just change the amount of energy needed to move.
Choosing a woofer with higher breakup frequencies ensures less associated distortion even if we have seen in breakup article that there are some important tricks about it.
The air core inductors with active filtering solution especially work well in the case of high sensitivity PA drivers.
EQ and High-Sensitivity Woofers
At the same woofer size, understanding the same emitting surface, and same load, aka the charge volume of the speaker (volume of the box), the level below 50hz will be globally close for the same amount of energy (Volt given by power amplifier).
Even if we equalize our high-sensitivity woofer to match the low-end response of another lower-sensitivity woofer in the same box volume, there likely won’t be a significant difference in distortion.
This is because low-end distortion is primarily caused by cone physical movement (extrusion), which affects all woofers of the same size similarly regardless of sensitivity.
So in the case of High-Sensitivity Woofers it is not a problem to add -3dB high shelf in low end to create a flatter response in low ends frequencies.
Conclusion
While achieving powerful and clean bass often relies on a woofer’s inherent qualities like sensitivity, SPL, and Fs, high-sensitivity woofers offer some flexibility with EQ to have a flatter low end response.
Adding a slight -3dB high shelf EQ in the low end increase bass without a significant rise in distortion compared to another woofer in the same enclosure volume that would achieve the same response without EQ.
This is because woofers with the same size, enclosure volume, and emitting surface will produce similar sound pressure levels at low frequencies for the same amount of volt.
Furthermore, since low-end distortion is primarily caused by cone movement (extrusion), all woofers with the same diameter will experience similar levels of extrusion at the same decibel level, regardless of the amount of energy sent (sensitivity at the frequency).
However, it’s important to remember that EQ adjustments alter the speaker’s designed frequency response, so we should stay minimal in our EQ adjustments.
![]()
Dimensions
We begin by defining the box volume and the primary vent dimensions using VituixCAD.
We aim to avoid internal dimensions that are multiples of one another, as this will lead to cumulative and reinforcing standing-wave resonances at the same frequency.
VituixCAD offers a useful tool for this: Tools → Auxiliary → Box Volume
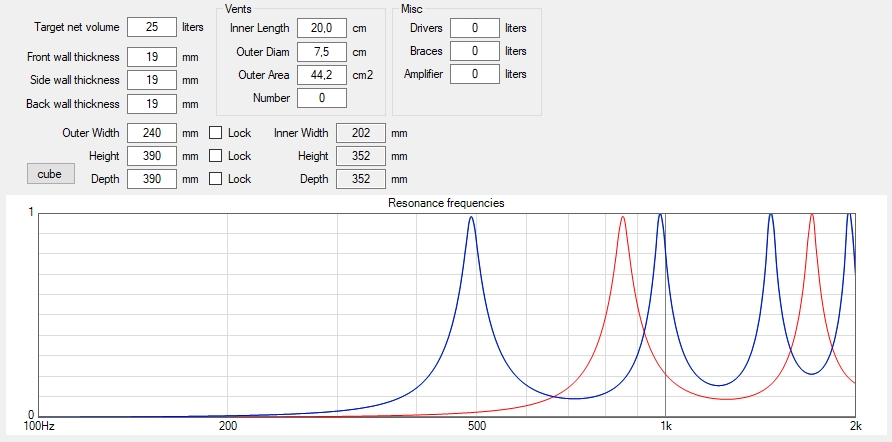
We can see that the box has no resonances below 300 Hz, because the wavelengths are too long compared to the internal cabinet dimensions.
This is almost always the case for subwoofers, where resonance wavelengths are much larger than the enclosure dimensions, reducing the need for stuffing in sealed design to increase the subwoofer’s perceived internal volume.
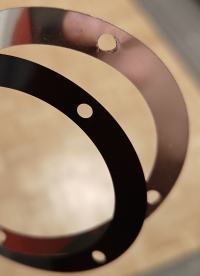
Braces
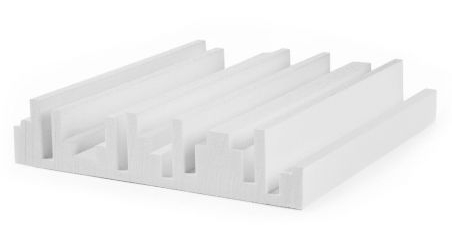
The I-beam (IPN-style) brace offers the best ratio of stiffness to occupied volume and provides rigidity across the full frequency range.
This is not the case with a simple cross brace centered in the box, which only reinforces at a narrow frequency.
Corners and panel junctions (typically at 90° in rectangular enclosures) are already structurally strong.
It’s in the center of each large panel that additional stiffness is required.
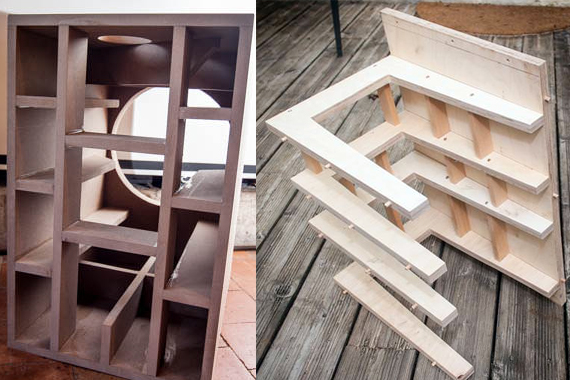
A cross brace without substantial reinforcement is ineffective.
Only strapping structures like the IPN-style brace provide broadband structural support.
Stuffing Materials
Polyfill
Low-density materials such as Poly-Fill or pillow stuffing are commonly used in sealed enclosures to simulate a larger internal volume, but they are not particularly effective at absorbing internal reflections.
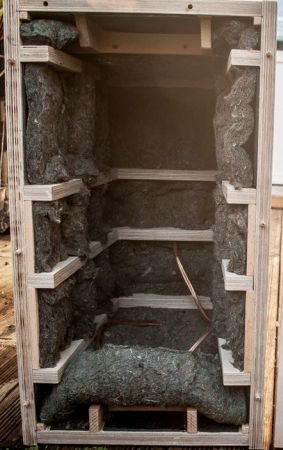
Waste fiber insulation
For side-wall damping, the best material is 20 mm (1 inch) waste fiber insulation used in automotive applications:
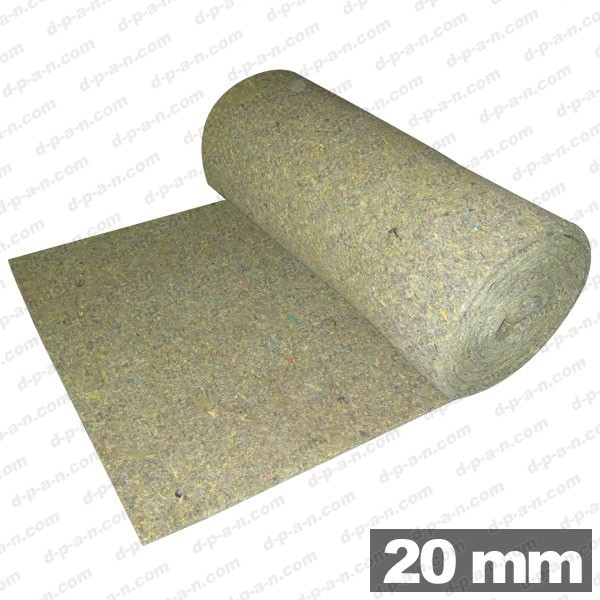
Waste-fiber insulation is a high-density damping material.
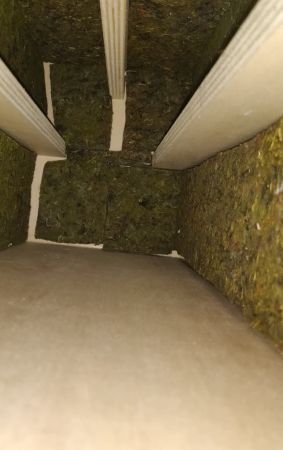
It is applied to all internal surfaces except the front panel and brace, with the thickness doubled on the top and bottom panels for tall speakers to address longer-wavelength resonances.
This treatment naturally adds a bit of virtual volume, helping to compensate for the space occupied by the internal bracing — exactly what we want.
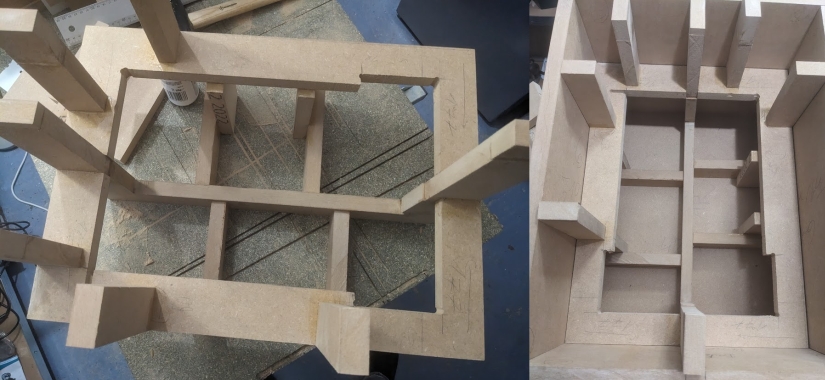
Woofer Stuffing
Because sealed woofers operate over a wider and higher passband than subwoofers, they are more likely to excite box resonances.
If you use two woofers in the same cabinet, it can be beneficial to separate their volumes internally to reduce the wavelength of resonances caused by an overly large internal dimension.
In some cases, creating an internal partition between the horn section and the woofer section can also shorten the largest cabinet dimension, helping to reduce long-wavelength resonances that are more difficult to damp. However, this approach reduces the available volume for the woofer because part of the enclosure is isolated for the HF section.
Vented Woofer Enclosures
Since the alignment is already tuned close to a Bessel response, placing stuffing in the path between the woofer and the port introduces resistive losses. These losses reduce port efficiency, shift the tuning, and, more importantly, decrease bass extension by lowering port SPL.
In vented enclosures:
- No Poly-Fill is used.
- Absorbing material must not be placed in the direct path between the woofer and the port.
- Waste-fiber insulation is applied to the internal walls, except the front panel.
- In the cabinet’s largest internal dimension, where the wavelength of the main reflection is long, the insulation layer should be made twice as thick to improve damping effectiveness.
Sealed Woofer Enclosures
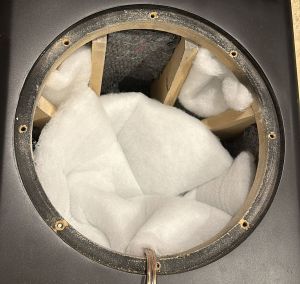
In this case, both the apparent volume increase and the damping of internal reflections become relevant.
In sealed enclosures:
- A combination of Poly-Fill and waste-fiber insulation may be used.
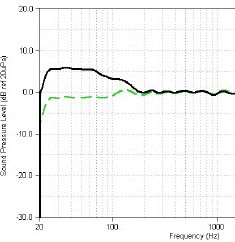
- When dealing with the cabinet’s largest dimension, the waste-fiber layer should also be doubled in thickness to better attenuate long-wavelength reflections.
- This approach increases the effective volume and reduces internal resonances, as shown in the picture.
Subwoofers Stuffing
For subwoofers, the practice is simple: in sealed designs, Poly-Fill is used extensively to increase the subwoofer’s perceived internal volume, while in vented designs it is generally avoided — or applied only in small amounts — because internal resonances are usually outside the woofer’s passband and we don’t want to reduce port efficiency without any other benefit.
Resonances inside subwoofer boxes are usually not an issue, as the wavelengths involved are much longer than the enclosure dimensions.
This means standing waves are effectively absent, and wall lining with waste-fiber insulation brings little to no benefit.
Summary
-
Poly-Fill: Increases the woofer’s perceived internal volume but has almost no effect on resonances due to its low density. Easy to use in sealed enclosures to adjust perceived volume.
-
Waste-fiber insulation on walls: Reduces and even suppress resonances thanks to its high density, while also slightly increasing perceived volume.
-
Port consequences: The more damping is applied, the more port efficiency is reduced. It’s a balance between resonance damping and port efficiency. Avoid placing damping in the path between the port and the driver to preserve port output, especially when using high-density stuffing.
This aspect usually doesn’t concern vented subwoofers, as there is almost no need for stuffing inside, as noted in Subwoofers Stuffing section.
-
Usual usage:
- Vented Woofer: Waste-fiber insulation on walls
- Sealed Woofer: Waste-fiber insulation on walls and, if adding volume is needed, Poly-Fill
- Vented Subwoofer: Usually nothing
- Sealed Subwoofer: Poly-Fill in large amounts to add volume
![]()